Is ChatGPT a Substitute for Research Participants?
Making Sense of Silicon Subjects, Digital Twins, and Synthetic Control
This note is a companion to the Quasi-Experimental Designs chapter of Global Health Research in Practice. It introduces the synthetic control method—a quasi-experimental design for estimating causal effects when only one unit (or a small number of units) receives the intervention—using South Africa’s tobacco tax policy as a worked example.
The Backlash You May Have Seen
If you’ve been on LinkedIn recently, you’ve probably seen posts criticizing “synthetic research participants.” It’s the idea that AI-generated personas can replace real people in surveys, focus groups, and interviews. Companies have attracted significant venture capital on this premise: give an LLM a demographic profile, and it will answer questions as if it were a research participant. Faster, cheaper, and no IRB required, they claim.
The criticism has been swift, and probably deserved. A systematic review of 182 studies (Kuric, Demcak, and Krajcovic 2026) found that LLM-generated responses are plagued by systematic distortions: they lack the variability of real human data, reproduce stereotypes, and diverge from human patterns in cognition, reasoning, and personality. The review concluded that LLM-generated synthetic participants are “inadequate as representations of human cognition and behavior” and should be understood as heuristic tools, not substitutes for real participants. Controlled experiments reinforce this. Gao et al. (2025) tested eight popular LLMs on a simple economic game chosen specifically because it was unlikely to be in training data. Nearly all failed to reproduce human response distributions, and advanced techniques—prompt engineering, retrieval-augmented generation, fine-tuning—did not fix the problem. The one model that appeared to succeed (a fine-tuned GPT-4o) was likely memorizing the provided examples.1
I believe the critics are right. An LLM responding to a survey prompt is not generating new evidence about the world. It’s producing text that is statistically consistent with its training data. If you are studying how farmers in western Kenya respond to a new insurance product, asking GPT to role-play a Kenyan farmer does not give you new data. It gives you a recombination of existing text.
The other side of this debate. Not everyone agrees. Argyle et al. (2023) conditioned GPT-3 on thousands of real sociodemographic backstories from U.S. surveys to generate what they call “silicon subjects”—one per human participant—and found that the model’s response distributions closely mirrored those of human subgroups, a property they call “algorithmic fidelity.” The paper is worth reading. But note that earlier waves of the validation survey (ANES) were almost certainly in GPT-3’s training corpus, and while the authors tested with post-training-cutoff data (2020), it is difficult to rule out that the model learned durable patterns from prior waves rather than genuinely generalizing.
But “synthetic” does not mean the same thing in every context. There is a well-established causal inference method called synthetic control that has nothing to do with AI-generated participants. It builds counterfactuals from real data. And there are emerging AI applications that use machine learning to improve causal inference in legitimate ways. The silicon subjects debate is a good excuse to talk about these real methods.
The Problem Synthetic Control Solves
Imagine you want to know whether a large-scale health investment changed outcomes in the countries that received it. You can’t randomize which countries get funded, you can’t find a single comparison country that matches on every relevant dimension, and you have only a handful of treated units.
This is a common situation in global health. National policies, donor programs, and system-wide interventions are implemented at the country level, often in a small number of places, for reasons that are entangled with the outcomes you want to measure. The countries that receive the most funding are often the ones with the greatest need, which means naive comparisons will be biased.
The synthetic control method, introduced by Abadie and Gardeazabal (2003) and formalized by Abadie, Diamond, and Hainmueller (2010), offers a different approach. Instead of choosing a single comparison unit, you construct one. You take a pool of untreated units and find a weighted combination of them that closely matches the treated unit’s trajectory before the intervention. That weighted combination—the synthetic control—becomes your counterfactual: an estimate of what would have happened without the intervention.
The logic is straightforward:
- Identify the treated unit and the intervention date.
- Assemble a “donor pool” of untreated units.
- Find the weights that make the weighted average of the donor units track the treated unit as closely as possible during the pre-intervention period.
- Project the synthetic control forward into the post-intervention period.
- The gap between the treated unit and its synthetic control is the estimated treatment effect.
The key insight is that no single comparison unit needs to be a good match. A country that is too rich, combined with one that is too poor, combined with one that has too little HIV burden, can together produce a composite that tracks the treated unit closely. The weights are chosen by an optimization procedure, given the researcher’s choice of predictors and donor pool.2
Think of it like a recipe. Suppose you want to construct a synthetic version of Country A. You’ve got ten potential comparison countries, and an optimization procedure assigns each one a weight between 0 and 1, with the weights summing to 1. Maybe Country B gets a weight of 0.4, Country C gets 0.3, Country D gets 0.2, and the rest get small weights or zero. To calculate the synthetic control’s value in any given year, you simply take the weighted average of the donor countries’ values that year: 40% of Country B’s outcome, plus 30% of Country C’s, plus 20% of Country D’s, and so on. The procedure searches for the set of weights that makes this weighted average track Country A as closely as possible across all the pre-intervention years.
The core assumption is that if the synthetic control closely tracks the treated unit before the intervention, it provides a credible estimate of what would have happened after, absent the intervention. But if you can’t achieve good pre-intervention fit, the method isn’t reliable. And even with good fit, the estimate is only valid if no other shock differentially hits the treated unit at the same time as the intervention. If another policy or event coincides with the treatment, the estimated effect may capture both.
Tobacco Taxes in South Africa
A study by Chelwa, van Walbeek, and Blecher (2017) in Tobacco Control illustrates the method clearly. They asked: did South Africa’s aggressive tobacco tax increases actually reduce cigarette consumption, or would consumption have declined anyway?
The question matters because cigarette consumption in South Africa was already falling before the tax increases began. Starting in 1994, the newly elected ANC-led government aggressively raised excise taxes on cigarettes. By 2004, the real excise tax had increased by 249%, and the average real retail price had risen by 110%. But consumption had been declining since the early 1990s for other reasons—economic contraction, growing public health awareness, and early regulatory steps like warning labels. A simple before-and-after comparison would credit the entire decline to the tax policy, overstating its effect. To isolate the causal impact, you need a counterfactual: what would consumption have looked like without the tax increases?
Building synthetic South Africa
The researchers assembled a donor pool of 24 countries—Latin American, sub-Saharan African, North African, and South-East Asian nations, plus three BRICS members (Brazil, India, and China)—that did not implement large-scale tobacco control measures during the study period.3 They excluded high-income countries and those without complete data, ensuring the donor pool consisted of structurally similar economies.
The matching predictors were standard drivers of cigarette demand: the real price of a pack of cigarettes, real GDP per capita, alcohol consumption per capita, the proportion of adults in the population, and lagged values of per capita cigarette consumption.4
The optimization produced a synthetic South Africa composed of five countries:
| Country | Weight |
|---|---|
| Brazil | 47.6% |
| Argentina | 27.6% |
| Chile | 14.6% |
| Tunisia | 9.4% |
| Romania | 0.7% |
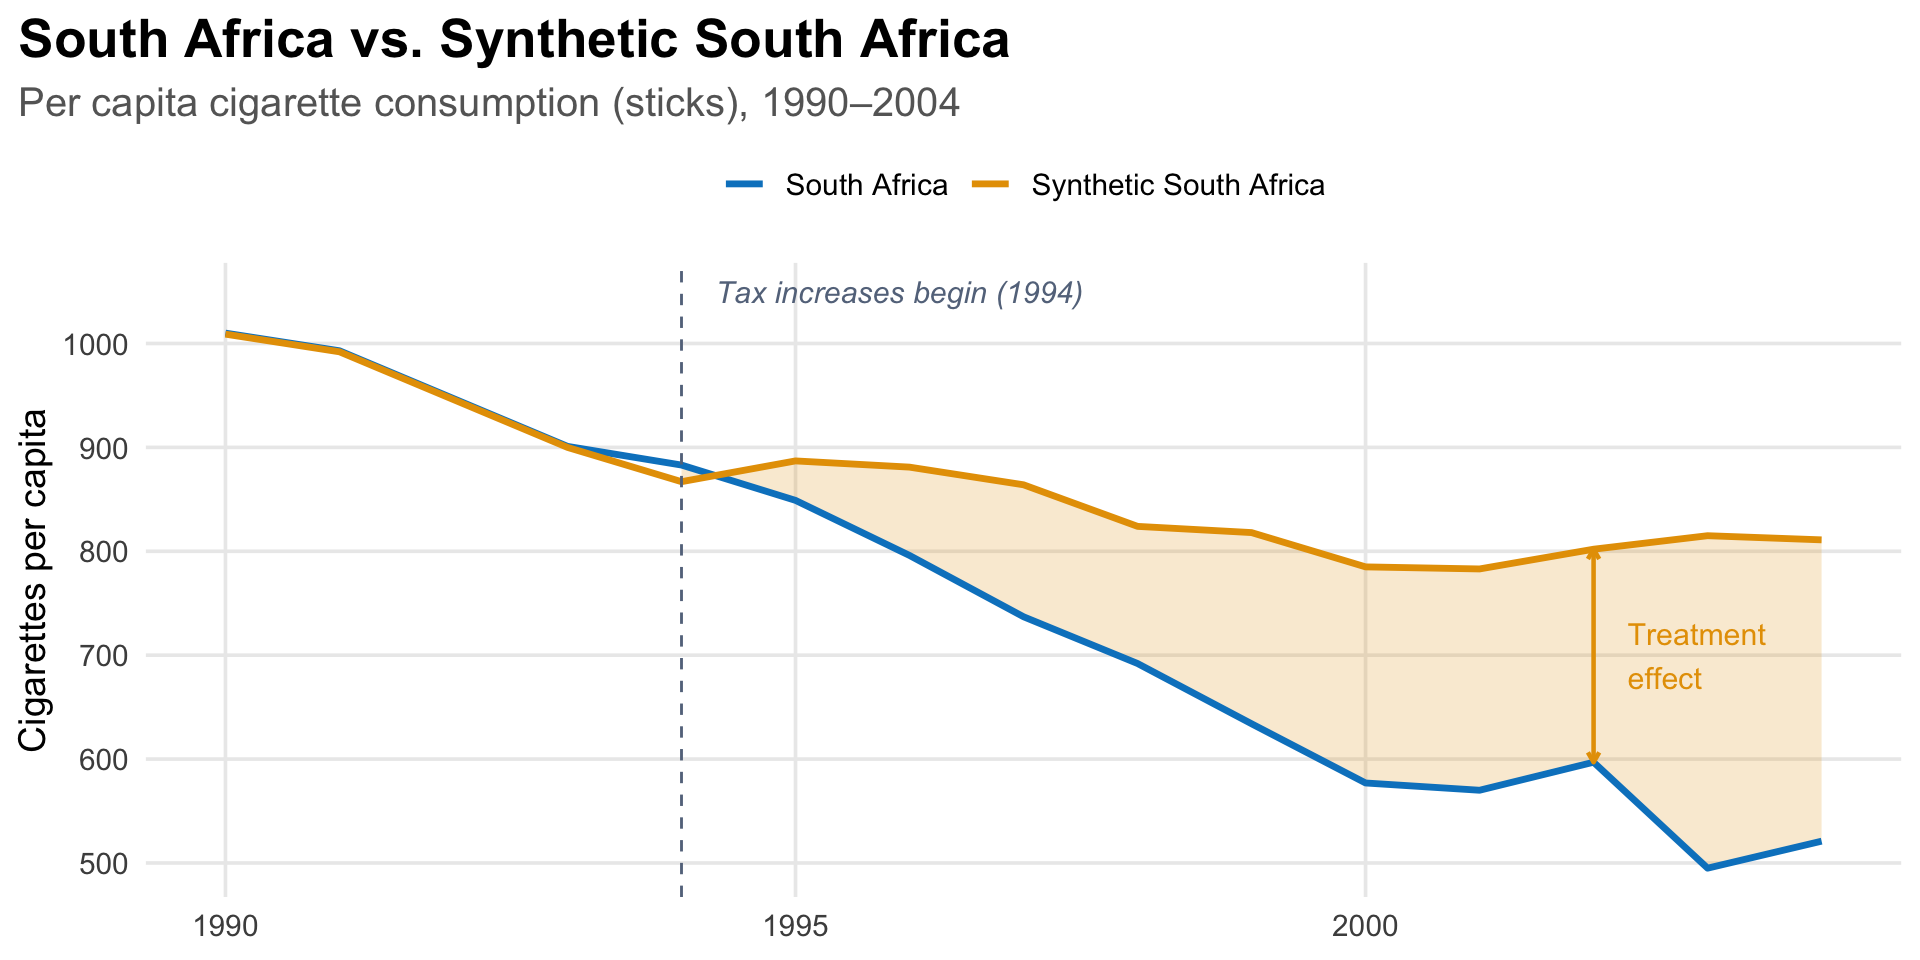
Synthetic South Africa is roughly 90% Latin American by weight. None of these countries individually resembles South Africa. But together, weighted appropriately, they reproduce its pre-1994 cigarette consumption trajectory almost exactly—the difference between real and synthetic South Africa in each pre-treatment year was about 1 stick per capita out of roughly 1,000.
What they found
By 2004, South Africa’s per capita cigarette consumption was about 290 cigarettes lower than synthetic South Africa’s—36% lower than it would have been without the tax increases. The treatment effect grew steadily: by 1995, the first full year after treatment, South Africa’s consumption was already 38 cigarettes (about 4%) below the counterfactual. The gap widened every year after that.
Notice something important in the figure: synthetic South Africa’s consumption does not keep falling after 1994. It levels off, fluctuating between about 780 and 890 cigarettes per capita through 2004. This makes sense. Between 1980 and 1994, South Africa’s real GDP per capita had declined at an average rate of 1% per year, and since cigarette consumption is positively related to income, the pre-1994 decline in consumption was largely driven by economic contraction, not public health policy. After 1994, GDP per capita grew at about 2% per year. Without the tax increases, consumption would likely have stopped declining, which is exactly what the synthetic control shows. A simple before-and-after comparison would miss this entirely, attributing the full decline to the policy when much of the pre-1994 drop was economic.
How do you know the effect is real?
The researchers ran leave-one-out robustness checks, re-estimating the synthetic control after dropping each of the five positively-weighted donor countries in turn (Figures 3–7 in the paper). If the treatment effect were driven by a single country, say Brazil, which carries nearly half the weight, the estimate would collapse when that country is removed. It did not. The pattern of divergence between South Africa and its synthetic control was similar across all five specifications, indicating that the result was not an artifact of any one country’s influence.
They also tested an alternative definition of the donor pool. Their main specification identified untreated countries based on whether cigarettes became more affordable over the study period (a proxy for the absence of tobacco control measures). As a robustness check, they re-estimated the model using the average annual change in real cigarette prices as the treatment criterion instead. The trajectory of synthetic South Africa under this alternative specification was similar to the main result (Figure 8).
A common additional check in synthetic control studies is to run “placebo tests”: apply the method to each donor country as if it were the treated unit, and see whether South Africa’s estimated effect is unusually large by comparison. If most placebo estimates are small and South Africa’s is an outlier, that strengthens the causal interpretation.
A Recent Application: U.S. Health Investments and Women’s Mortality
In 2025, the U.S. government began dramatically cutting foreign assistance, including health investments administered through USAID. Some of the cuts targeted programs in HIV/AIDS, maternal health, and infectious disease. A recurring argument behind these cuts was that the aid had not produced meaningful results. A 2025 study in the Journal of Global Health by Ahsan and colleagues used the synthetic control method to test that claim directly. They asked whether sustained U.S. government (USG) health investments reduced mortality among women of reproductive age (WRA, ages 15–49) across 16 low- and middle-income countries.
The design followed the same logic as the South Africa example, but at a larger scale: the researchers aggregated 16 treated countries into a single unit and constructed a synthetic control from 19 untreated countries, matching on health, economic, demographic, and governance indicators. They found that mortality was significantly lower in the treated countries after 2005, when USG health funding sharply increased. Their conservative estimate, after adjusting for the possible contribution of non-USG donor funding: 1.0 to 1.3 million deaths averted between 2009 and 2019.5
What “Synthetic” Means Here
In the synthetic control method, “synthetic” means constructed from real data. The counterfactual is synthetic in the same sense that a composite sketch is synthetic, assembled from real features to approximate something you cannot directly observe. Every data point in the synthetic control comes from a real country. The method determines the weights; the data are genuine.
This is the opposite of what “synthetic participants” companies are selling. There, “synthetic” means generated by a language model—text that resembles human responses but reflects training data distributions rather than any real person’s experience.
| Synthetic control | Synthetic participants | |
|---|---|---|
| Data source | Real outcomes from real units | LLM-generated text |
| What is “synthetic” | The combination (weights) | The data themselves |
| Counterfactual basis | Observed pre-treatment trajectories | Training data patterns |
| Validation | Placebo tests, pre-treatment fit | Often none |
| Regulatory acceptance | Used in published research, policy evaluation | Widely criticized |
Where AI Actually Fits
AI is changing how research is done. But the most promising applications are not replacing real participants with fake ones. They are making better use of real data to sharpen causal inference. The methods gaining traction with regulators are prediction models trained on structured clinical data, not large language models generating survey responses.
Digital twins
For instance, consider a well-known problem in clinical trials: patient-to-patient variability. Two people with the same diagnosis can progress at very different rates for reasons that have nothing to do with the treatment being tested. This variability is noise, and it is expensive. The noisier the outcome, the more patients you need to detect a real effect. If you can predict part of a patient’s outcome from baseline data, you can adjust for that prediction and reduce noise. Machine learning is making those predictions much stronger.
Unlearn.AI is one of the most visible companies in this space. They train what they call “Digital Twin Generators” (DTGs)—machine learning models trained on structured patient-level data from historical clinical trials: demographics, lab values, disease severity scores, and longitudinal outcomes.6 Given a new patient’s baseline data, the model generates a forecast of what would happen to that patient under standard of care—predicted scores on clinical scales, lab values, and biomarkers at each future visit. This forecast is what Unlearn calls a “digital twin.”7
Traditional covariate adjustment uses a handful of baseline variables: age, disease severity, perhaps one or two biomarkers. The digital twin approach pushes this further. Because the DTG is trained on thousands of historical patient records spanning multiple outcomes and time points, it produces a single prognostic score that captures far more of the predictable variation than any small set of covariates could. The stronger the prognostic score, the more variance it absorbs, and the more precise the treatment effect estimate becomes.
Their method, called PROCOVA (Prognostic Covariate Adjustment), includes this AI-generated prognostic score as a pre-specified covariate in the trial’s primary analysis model.8 The trial is still randomized. Every participant is still a real person. But because the model explains a large share of the outcome variability, you can achieve the same statistical power with fewer control arm patients.9
This is a fundamentally different proposition from synthetic participants. The AI can reduce the number of participants needed in the control arm. Not by replacing specific people, but by making better use of the data from those who are enrolled. The predictions come from learning what real patients’ trajectories look like under standard care, not from generating fake responses. The data behind the prediction are real; the trial design is still randomized; and the approach has regulatory interest, if not yet a long track record of prospective use.
Take-Home Messages
The word “synthetic” means something very different in the causal inference literature. Synthetic control constructs a counterfactual from real data. Synthetic participants fabricate data from a language model.
The synthetic control method solves a real problem in global health evaluation. When only a few units receive an intervention and randomization is impossible, constructing a weighted counterfactual from donor units offers a principled way to estimate causal effects. South Africa’s tobacco tax evaluation shows how this works: no single country provides a credible comparison, but a weighted combination of five countries reproduces the pre-intervention trajectory almost exactly.
Pre-treatment fit is everything. The method’s credibility rests on how well the synthetic control tracks the treated unit before the intervention. If the fit is poor, the post-treatment gap cannot be attributed to the intervention.
AI has a legitimate role in causal inference, but not as a replacement for real participants. At least not yet. Prognostic models can use machine learning to improve counterfactual predictions and reduce the burden on control arm patients. Methods like PROCOVA have regulatory interest and promising retrospective results, though the prospective track record is still developing. The key distinction: these approaches learn from real patient data to sharpen inference, rather than fabricating evidence.
Footnotes
For a deeper methodological critique, see Hullman et al. (2025), who argue that even when LLM outputs appear to match human data, this heuristic validation cannot guarantee the absence of systematic biases and is unsuitable for confirmatory research.↩︎
The weights are constrained to be non-negative and sum to one, which ensures the synthetic control is a convex combination of donor units—an interpolation, not an extrapolation. This is one of the method’s key advantages over regression, which can place negative or extreme weights on comparison units and produce counterfactuals outside the range of the data. The tradeoff is that if the treated unit is very unusual—outside the “convex hull” of the donor pool—the method cannot produce a good match.↩︎
The evaluation ends in 2004 because the WHO Framework Convention on Tobacco Control (FCTC) took effect in 2005. After that, many donor pool countries began implementing their own tobacco control policies, which would contaminate the comparison.↩︎
Including lagged values of the outcome as predictors is a key feature of the synthetic control method. As Abadie, Diamond, and Hainmueller (2010) show, matching closely on pre-treatment outcomes helps control for unobserved confounders—the logic being that only units similar on both observables and unobservables would follow the same trajectory over many time periods.↩︎
The study is not a textbook synthetic control example. Aggregating 16 countries into a single treated unit probably masks heterogeneity, and the inference procedures are more complex than the standard permutation approach. With only 19 donor countries, standard rank-based permutation inference produces a minimum p-value of 1/20 = 0.05. The authors report p < 0.001 using a “standardized” approach that adjusts for pre-treatment fit quality, which goes beyond the standard Abadie et al. framework.↩︎
Unlearn describes the architecture as “Neural Boltzmann Machines, a proprietary machine learning architecture optimized for probabilistically modeling complex, multivariate, clinical time-series data.” These are not language models. They do not generate text. They learn patterns from real clinical records to predict outcomes.↩︎
Fisher, C. & D’Angelo, H. Defining digital twins in drug discovery and development. Unlearn.AI whitepaper.↩︎
In 2022, the European Medicines Agency qualified PROCOVA as an acceptable statistical approach for the primary analysis of Phase 2 and 3 trials with continuous outcomes (EMADOC-1700519818-907465). The FDA has issued general guidance supporting covariate adjustment in randomized trials (May 2023), which Unlearn cites as aligned with their approach, but the FDA hasn’t issued a qualification specific to PROCOVA.↩︎
The evidence for sample size reduction comes primarily from retrospective re-analyses of completed trials. In Alzheimer’s disease, Unlearn reports control arm reductions of 18–25% in a Phase 2 trial (AbbVie’s tilavonemab study) and 30–33% in Phase 3 trials (bapineuzumab), with power increases from 80% to 90% in the Phase 3 analyses—a 50% reduction in Type II error. These are promising numbers, but they describe what could have happened had the method been used prospectively, not what did happen in an actual trial designed around it. The underlying analyses were presented as conference posters at AAIC 2024 and AD/PD 2025, not as peer-reviewed publications.↩︎