Chapter 5 · Video 3
A real methods section, read out loud
Print layout
Slide 1


A real methods section, read out loud
Slide 2
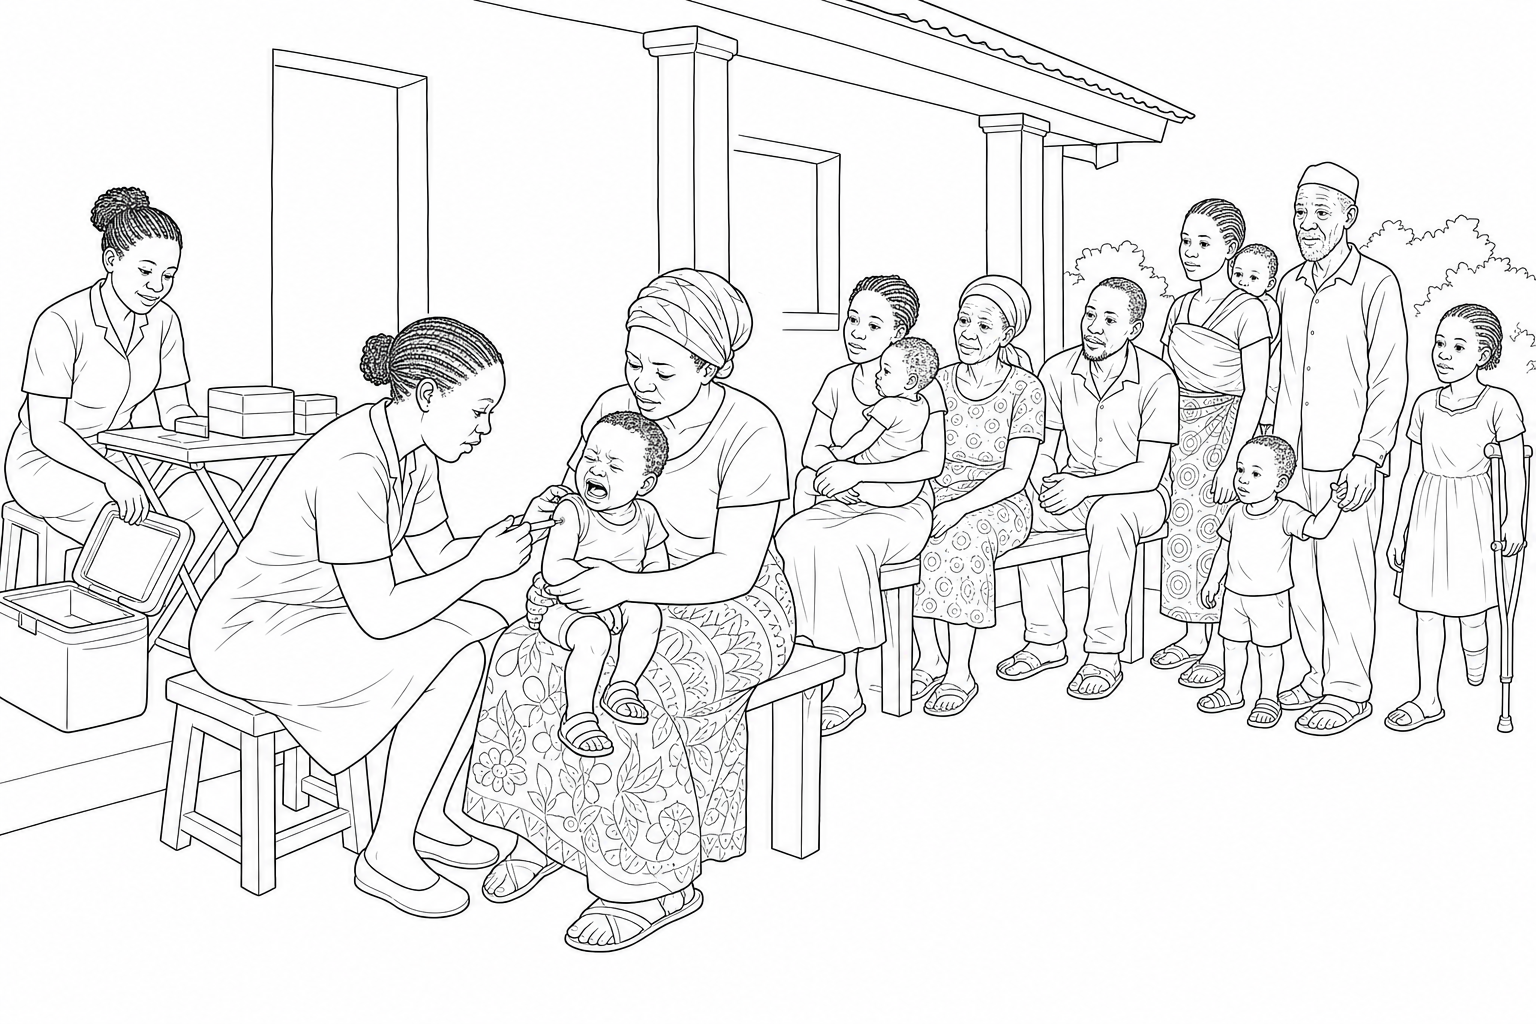
The RTS,S malaria vaccine pilot introduction. Asante et al., 2024.
A vaccine delivered through routine immunization
Ghana, Kenya and Malawi
Feasibility, safety, impact
Slide 3
Asante et al., 2024
Three objectives. That’s ambitious.
Feasibility, safety, and impact when delivered through routine programs
Are these weighted equally, or is one primary?
Impact on severe malaria is the main focus; safety signals are key secondary
Slide 4
Asante et al., 2024
“158 geographical clusters were randomly assigned”
A cluster-randomized trial — areas, not individuals
But wait: why not randomize children individually?
You can’t offer a vaccine to one child at a clinic and refuse the next in line
Slide 5
Asante et al., 2024
Two-thirds completed the primary series
Surveillance covered children aged 1 to 59 months
Coverage 73–79% for dose one, 62–66% for all three doses
If only two-thirds completed, what does that do to the comparison?
Slide 6
Asante et al., 2024
Here is where I had to slow down
They don’t compare vaccinated children to unvaccinated children
They compare age-eligible children across implementation and comparison areas
Then a “double ratio” method — I didn’t fully grasp this on first read
Slide 7
Asante et al., 2024
Why meningitis and cerebral malaria specifically?
Primary outcomes: severe malaria admission, meningitis, cerebral malaria, mortality
The phase 3 trial had shown concerning signals for these outcomes
This study was partly designed to see if they appeared in real-world use
Slide 8
Asante et al., 2024
Where could bias enter? Three questions came to mind.
Were clusters balanced at baseline? Constrained randomization — on which variables?
Could children cross between areas? Some contamination is possible.
Was outcome measurement comparable? They checked with tracer conditions. Clever.
Slide 9
Asante et al., 2024
Pre-registered, with a published analysis plan
An independent data safety monitoring board
Conflicts disclosed; several authors worked on earlier trials
Does that bias them toward favorable results? Possible.
Slide 10
Asante et al., 2024
A 32% reduction in hospital admission with severe malaria
IRR 0.68, 95% CI 0.49–0.95
And a 9% reduction in all-cause mortality: IRR 0.91, 95% CI 0.82–1.00
That mortality interval just barely touches 1.00
Slide 11
IRR 0.68 — the incidence rate ratio
The ratio of event rates between two groups
Vaccinated areas had 68% of the hospitalization rate of comparison areas
One minus 0.68 is 0.32, so: a 32% reduction
Slide 12
95% CI 0.49 to 0.95 — the range compatible with the data
From a 51% reduction at one end to a 5% reduction at the other
The entire interval falls below 1.0, so even the conservative estimate is a benefit
Precision: the interval is fairly wide, spanning a five-fold range of effect sizes
Slide 13
In Closing
A first read orients you. Later reads deepen it.
This pass took about 15 minutes
Several questions still need the Methods and the supplement
Next: what that interval is, and why it beats a p-value
A real methods section, read out loud
Slide 1Six questions on a slide are easy to agree with. Here is what they look like applied to a real paper, out loud, including the parts that stayed fuzzy on the first pass for me.
The RTS,S malaria vaccine pilot introduction. Asante et al., 2024.
A vaccine delivered through routine immunization
Ghana, Kenya and Malawi
Feasibility, safety, impact
Slide 2The paper is a study of the RTS,S malaria vaccine in Ghana, Kenya, and Malawi. The study aimed to assess feasibility, safety, and impact of the vaccine when delivered through routine immunization programs.
Asante et al., 2024
Three objectives. That’s ambitious.
Feasibility, safety, and impact when delivered through routine programs
Are these weighted equally, or is one primary?
Impact on severe malaria is the main focus; safety signals are key secondary
Slide 3Start with the research question. Three objectives. That's ambitious. My first question: are these weighted equally, or is one primary? The Methods clarify that impact on severe malaria is the main focus, with safety signals from earlier trials as key secondary concerns.
Asante et al., 2024
“158 geographical clusters were randomly assigned”
A cluster-randomized trial — areas, not individuals
But wait: why not randomize children individually?
You can’t offer a vaccine to one child at a clinic and refuse the next in line
Slide 4Then the design. The abstract says 158 geographical clusters were randomly assigned to early or delayed introduction of the vaccine. Okay: a cluster-randomized trial. Areas, not individuals, were randomized. But wait, why not randomize children individually? I had to dig for this. The authors explain that you can't offer a vaccine to one child at a clinic but refuse the next child in line. Randomizing districts solves that, though I know it introduces analytical complexity. A question for deeper reading: how did they handle the non-independence of outcomes within clusters?
Asante et al., 2024
Two-thirds completed the primary series
Surveillance covered children aged 1 to 59 months
Coverage 73–79% for dose one, 62–66% for all three doses
If only two-thirds completed, what does that do to the comparison?
Slide 5Now the sampling. Surveillance covered children aged one to fifty-nine months. By April 2021, over 650,000 children had received at least one dose. Coverage was 73 to 79 percent for dose one, dropping to 62 to 66 percent for all three primary doses. This raised a flag. If only two-thirds completed the series, how does that affect the comparison? This is actually important. It means the implementation versus comparison area analysis is diluted. Not everyone in implementation areas actually got vaccinated. I'd want to return to the supplement to see how they handled partial vaccination.
Asante et al., 2024
Here is where I had to slow down
They don’t compare vaccinated children to unvaccinated children
They compare age-eligible children across implementation and comparison areas
Then a “double ratio” method — I didn’t fully grasp this on first read
Slide 6Here is where I had to slow down: the comparison. They don't simply compare vaccinated to unvaccinated children. That would introduce selection bias, because families who vaccinate might differ systematically. Instead, they compare age-eligible children in implementation areas to age-eligible children in comparison areas. Then they use something called a double ratio method. Honestly, I didn't fully grasp this on first read. The basic idea: compare the ratio of events between eligible and non-eligible age groups, and see if that ratio differs between implementation and comparison areas. It controls for baseline differences between areas. For a thorough read, I'd need to work through their statistical appendix.
Asante et al., 2024
Why meningitis and cerebral malaria specifically?
Primary outcomes: severe malaria admission, meningitis, cerebral malaria, mortality
The phase 3 trial had shown concerning signals for these outcomes
This study was partly designed to see if they appeared in real-world use
Slide 7Outcomes. Primary outcomes include hospital admission with severe malaria, meningitis, cerebral malaria, and all-cause mortality. Why meningitis and cerebral malaria specifically? The phase 3 trial had shown concerning signals for these outcomes, more cases in vaccinated children. So this study was partly designed to see if those signals appeared in real-world use. That context matters for interpretation.
Asante et al., 2024
Where could bias enter? Three questions came to mind.
Were clusters balanced at baseline? Constrained randomization — on which variables?
Could children cross between areas? Some contamination is possible.
Was outcome measurement comparable? They checked with tracer conditions. Clever.
Slide 8Then, where could bias enter? Several questions came to mind. Were clusters balanced at baseline? They used constrained randomization to ensure balance, but on which variables? I'd need to check the supplement. Could children cross between areas? Some contamination is possible if families travel for care, but probably limited. Was outcome measurement comparable across areas? They checked this using tracer conditions, conditions unlikely to be affected by the vaccine. Clever. Rates were similar, which is reassuring.
Asante et al., 2024
Pre-registered, with a published analysis plan
An independent data safety monitoring board
Conflicts disclosed; several authors worked on earlier trials
Does that bias them toward favorable results? Possible.
Slide 9Transparency. The study was pre-registered, with a published statistical analysis plan and an independent data safety monitoring board. Conflicts are disclosed, and several authors worked on earlier trials of the same vaccine. Does that bias them toward favorable results? Possible, but the pre-registration and the independent oversight help. I'd want to compare the published analysis to the pre-registered plan.
Asante et al., 2024
A 32% reduction in hospital admission with severe malaria
IRR 0.68, 95% CI 0.49–0.95
And a 9% reduction in all-cause mortality: IRR 0.91, 95% CI 0.82–1.00
That mortality interval just barely touches 1.00
Slide 10And the results. Introduction of the vaccine was associated with a 32% reduction in hospital admission with severe malaria, and a 9% reduction in all-cause mortality. That mortality confidence interval just barely touches 1.00. How robust is that finding? Importantly, there was no evidence of the safety signals from the phase 3 trial. But absence of evidence isn't evidence of absence. Was this study powered to detect those rare outcomes?
IRR 0.68 — the incidence rate ratio
The ratio of event rates between two groups
Vaccinated areas had 68% of the hospitalization rate of comparison areas
One minus 0.68 is 0.32, so: a 32% reduction
Slide 11Let's take the first of those results apart, because the sentence contains everything you need to evaluate it. Here is what the authors reported: introduction of the vaccine was associated with a 32% reduction in hospital admission with severe malaria, IRR 0.68, 95% confidence interval 0.49 to 0.95. If you're new to reading research, that might look like alphabet soup. Start with the effect size. IRR stands for incidence rate ratio, the ratio of event rates between two groups. An IRR of 0.68 means the vaccinated areas had 68% of the hospitalization rate seen in comparison areas. Put another way, there was a 32% reduction. One minus 0.68 is 0.32.
95% CI 0.49 to 0.95 — the range compatible with the data
From a 51% reduction at one end to a 5% reduction at the other
The entire interval falls below 1.0, so even the conservative estimate is a benefit
Precision: the interval is fairly wide, spanning a five-fold range of effect sizes
Slide 12Is 0.68 meaningfully different from 1.0, which would mean no difference? That's where the confidence interval comes in. The confidence interval tells you the range of effect sizes compatible with the data. Here, the data support effects ranging from a 51% reduction at 0.49, to only a 5% reduction at 0.95. The entire interval falls below 1.0, meaning even the most conservative estimate suggests some benefit. So from this single line we learn the direction: the vaccine reduced severe malaria hospitalizations. The magnitude: a point estimate of a 32% reduction, our best estimate. The uncertainty: we can't rule out that the effect falls between 5% and 51%. And the precision: the interval is fairly wide, spanning a five-fold range of effect sizes.
In Closing
A first read orients you. Later reads deepen it.
This pass took about 15 minutes
Several questions still need the Methods and the supplement
Next: what that interval is, and why it beats a p-value
Slide 13What we can't tell from that line is whether a 32% reduction is clinically meaningful, cost-effective, or worth the implementation challenges. Those are separate questions requiring additional context. But we now have the building blocks to ask them. This first pass took about 15 minutes. I understand the study's basic architecture, and several questions would still require returning to the Methods and the supplement. A first read orients you; subsequent reads deepen understanding. Next, the confidence interval on its own terms, and why it carries more than a p-value does.