Chapter 10 · Video 6
After randomization: attrition, non-compliance, and spillover
Print layout
Slide 1


After randomization: attrition, non-compliance, and spillover
Slide 2
What can go wrong between randomization and analysis
Participants drop out
Others don’t take the treatment they were assigned
These threats don’t invalidate an RCT, but ignoring them can
Slide 3
Attrition
Loss to follow-up reduces statistical power
Participants move, lose interest, get sick, or die
Planned for 200 per arm and 30% drop out: now underpowered
Slide 4
Attrition
Systematic attrition biases the comparison
Sicker participants leave the intervention arm because of side effects
The remaining treatment group looks artificially healthy
Slide 5
Attrition
Comparing completers and dropouts in each arm
Similar on measured characteristics, similar rates across arms: the threat is lower
Dropouts differ systematically between arms: no method can fully solve it
Slide 6
Attrition
Sensitivity analysis when outcomes are missing
Worst case: treatment-arm dropouts did badly, control-arm dropouts did well
More commonly: multiple imputation or inverse probability weighting
Report how sensitive the conclusions are to the assumptions
Slide 7
Non-compliance
Two forms of non-compliance
Assigned to intervention
Skip sessions or never show up
Assigned to control
Obtain the intervention on their own
Slide 8
How should non-compliance be handled in the analysis?
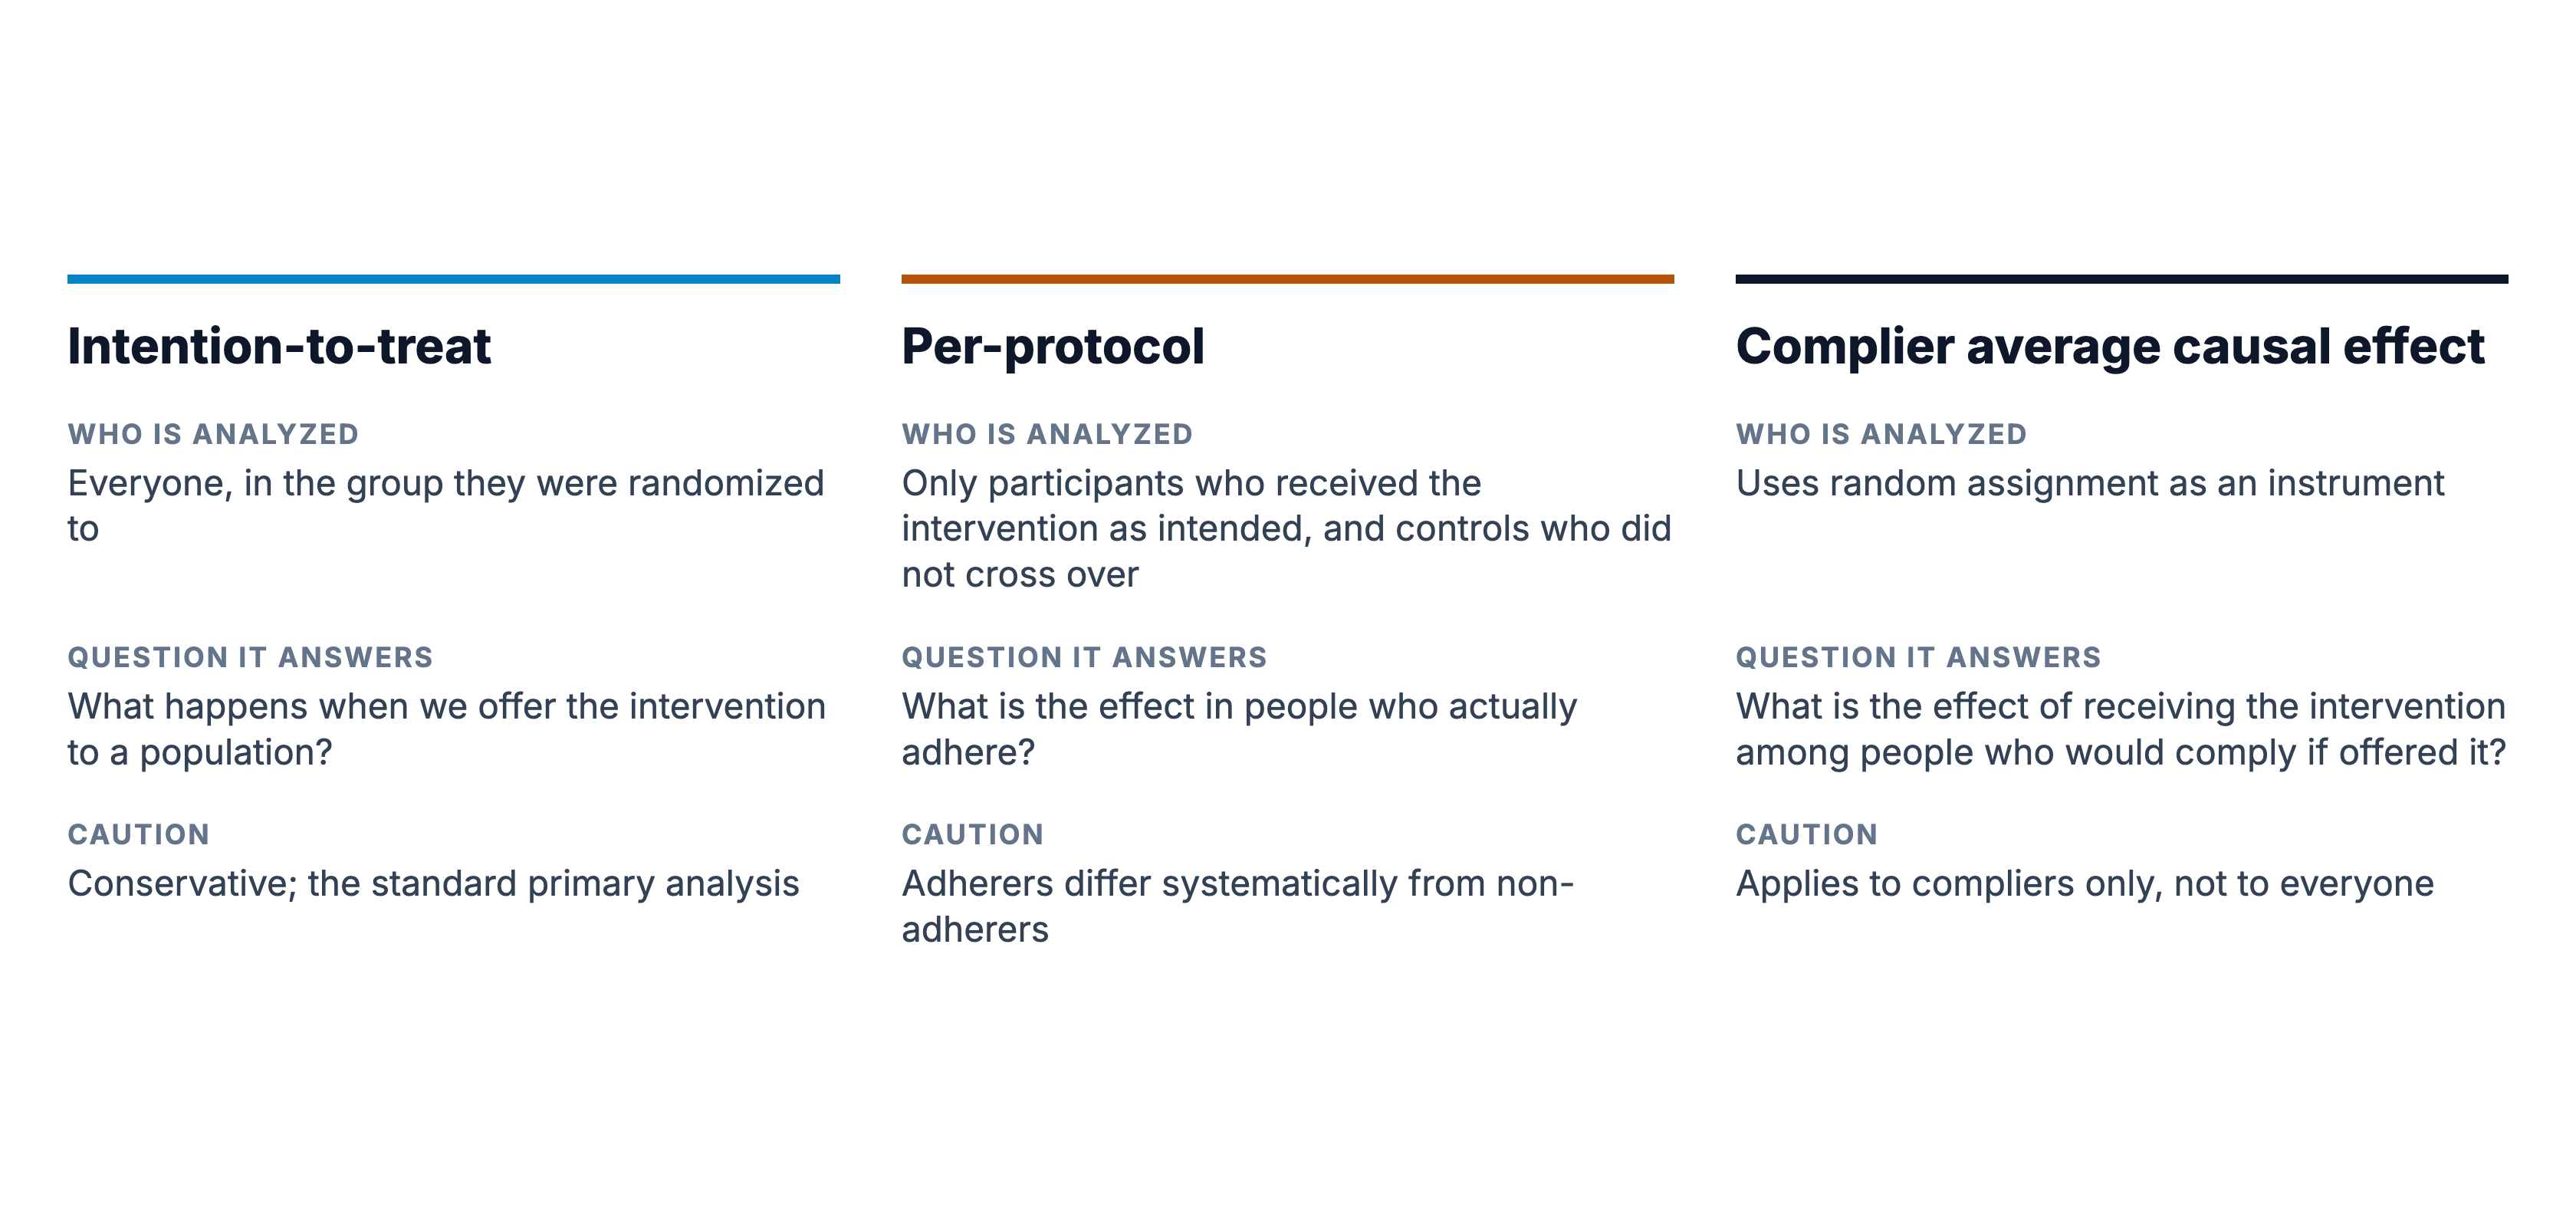
How the analysis handles non-compliance depends on the question we want to answer. Adapted from Chapter 10.
Slide 9
Intention-to-treat
Intention-to-treat estimates the effect of offering the intervention
Everyone stays in their randomized group, whatever they actually did
Preserves the benefits of randomization
The standard primary analysis, and it should always be reported
Slide 10
Per-protocol
Per-protocol analysis, and why adherers differ
Only participants who received the intervention as intended
Adherers tend to be healthier, more motivated, better supported
So it can introduce selection bias
Slide 11
CACE
The complier average causal effect uses randomization as an instrument
Assignment affects the outcome only through receiving treatment
Recovers a causal estimate for compliers, not for everyone
Report intention-to-treat first; the others as supplementary
Slide 12
Spillover
When one person’s treatment affects another person’s outcome
Deworming one child reduces transmission to nearby children
Vaccinating enough people creates herd immunity
Health information shared with one household spreads
Slide 13
Miguel & Kremer, 2004
School-based deworming in Kenya
Untreated children in treated schools experienced health gains
So did children in nearby untreated schools
Through reduced transmission
Slide 14
SUTVA
Spillover violates SUTVA and shrinks the estimated effect
Stable unit treatment value assumption: one person’s treatment doesn’t affect another’s outcome
Spillover can be biological, informational, or behavioral
The comparison group is also benefiting
Slide 15
Cluster randomization
Why we randomize clusters
The intervention is delivered at the group level
Spillover between individuals is likely
Individual randomization is impossible or culturally inappropriate
Slide 16
Intracluster correlation (ICC)
How similar are people within the same cluster?
Children in the same school share teachers, meals, and exposures
ICC of 1: every person in a cluster is a clone; effective sample size is 1
ICC of 0: clustering costs nothing statistically
Slide 17
An ICC of 0.05 with 50 children per school
Design effect = 1 + (50 − 1) × 0.05 = 3.45
We need 3.45 times as many participants as an individually randomized trial
Slide 18
The same total sample, with and without clustering
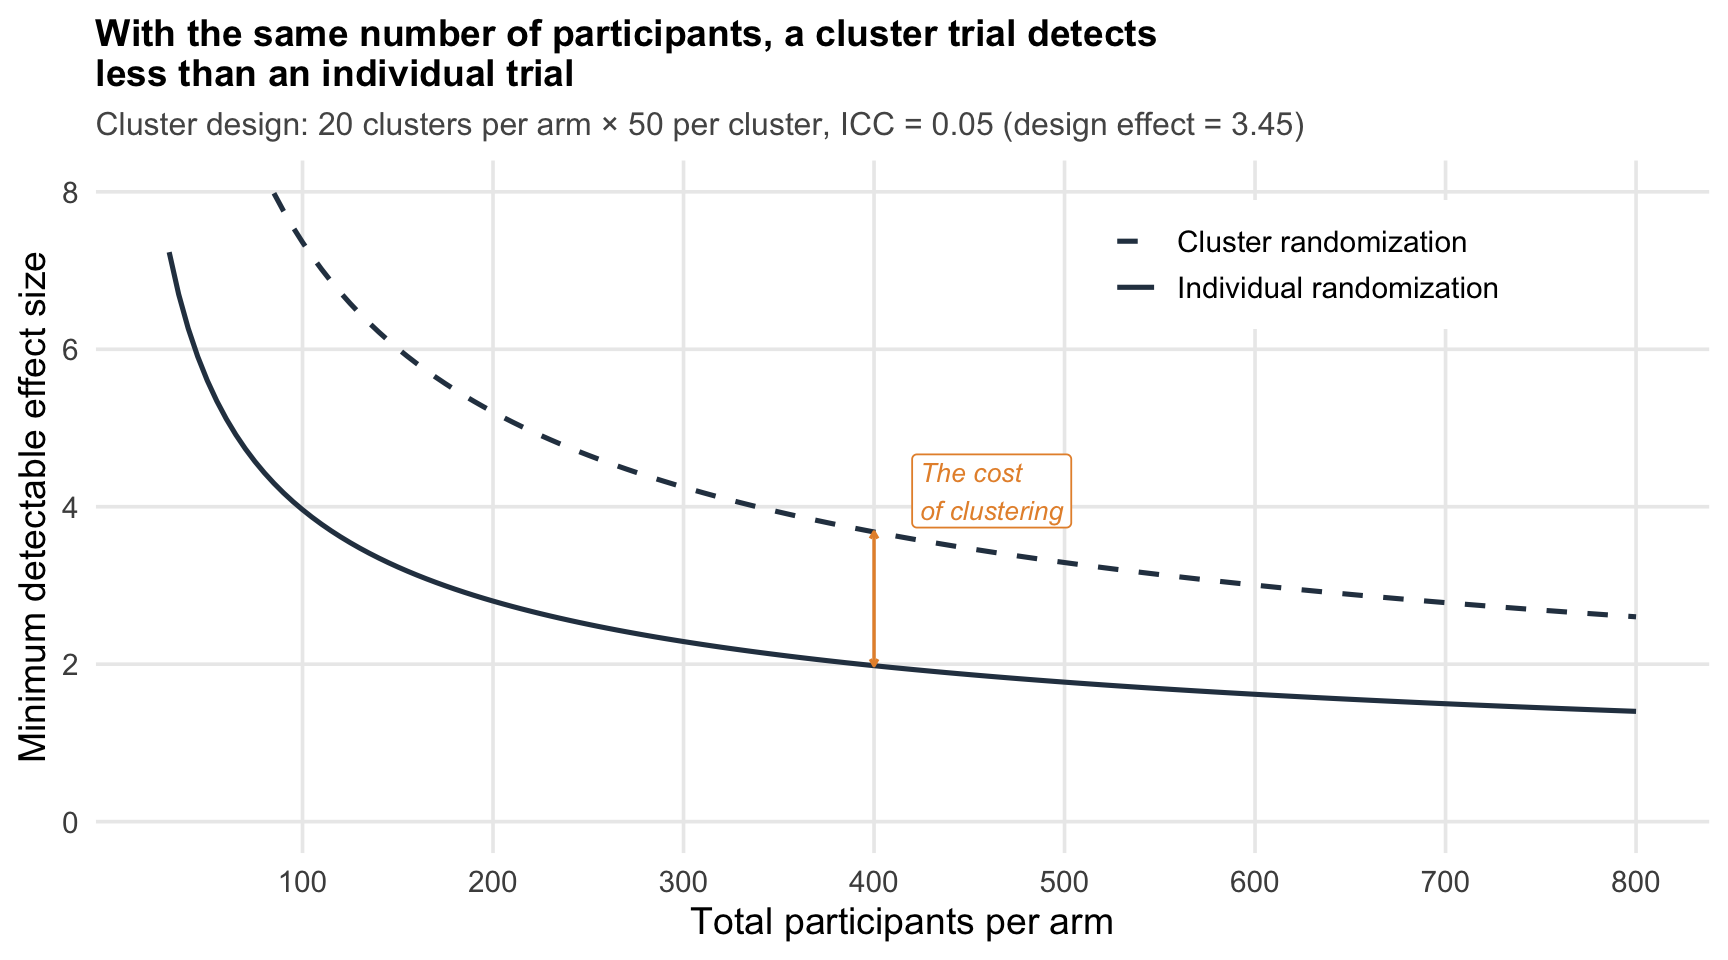
Both curves assume 80% power, alpha = 0.05, and an outcome SD of 10. The cluster design assumes 50 participants per cluster and an ICC of 0.05. Reproduced from Chapter 10.
Slide 19
In Closing
Plan for clustering in the sample size calculation
Ignoring it leads to underpowered studies and inflated Type I error
After randomization: attrition, non-compliance, and spillover
Slide 1Randomization gives us a fair comparison at baseline. Between randomization and analysis, three things can erode that comparison: participants drop out, participants don't follow the plan, and the treatment given to some people affects others.
What can go wrong between randomization and analysis
Participants drop out
Others don’t take the treatment they were assigned
These threats don’t invalidate an RCT, but ignoring them can
Slide 2Participants drop out. Others don't take the treatment they were assigned. These threats don't invalidate the RCT, but ignoring them can. We'll start with attrition, then non-compliance, and then spillover, which is the reason we randomize clusters.
Attrition
Loss to follow-up reduces statistical power
Participants move, lose interest, get sick, or die
Planned for 200 per arm and 30% drop out: now underpowered
Slide 3Some loss to follow-up is inevitable in any trial. Participants move, lose interest, get sick, or die. The immediate cost is statistical. Fewer participants means less power to detect an effect. If we planned for 200 per arm and 30% drop out, we're now running an underpowered study.
Attrition
Systematic attrition biases the comparison
Sicker participants leave the intervention arm because of side effects
The remaining treatment group looks artificially healthy
Slide 4But the real danger isn't the lost power. It's bias, when attrition is systematic. If sicker participants in the intervention arm drop out because the treatment has side effects, while healthier participants stay, the remaining sample no longer represents the population we randomized. The treatment group looks artificially healthy, and the comparison is no longer fair.
Attrition
Comparing completers and dropouts in each arm
Similar on measured characteristics, similar rates across arms: the threat is lower
Dropouts differ systematically between arms: no method can fully solve it
Slide 5How do we assess whether attrition is a problem? We start by comparing the baseline characteristics of completers and dropouts in each arm. If dropouts look similar to completers on measured characteristics, and attrition rates are similar across arms, the threat is lower. If dropouts in the treatment arm look systematically different from dropouts in the control arm, we have a problem that no statistical method can fully solve.
Attrition
Sensitivity analysis when outcomes are missing
Worst case: treatment-arm dropouts did badly, control-arm dropouts did well
More commonly: multiple imputation or inverse probability weighting
Report how sensitive the conclusions are to the assumptions
Slide 6When attrition does occur, sensitivity analysis is our main tool. The most conservative approach is to assume the worst: everyone who dropped out of the treatment arm had bad outcomes, and everyone who dropped out of the control arm had good outcomes. If the results hold under that extreme assumption, they're robust. More commonly, we'll use multiple imputation or inverse probability weighting to account for missing data under various assumptions, and report how sensitive our conclusions are to those assumptions.
Non-compliance
Two forms of non-compliance
Assigned to intervention
Skip sessions or never show up
Assigned to control
Obtain the intervention on their own
Slide 7Non-compliance takes two forms. Participants assigned to the intervention may not take it up. They skip sessions, don't take the medication, or never show up at all, since participation is voluntary. And participants assigned to control may obtain the intervention on their own. Both dilute the contrast between arms.
How should non-compliance be handled in the analysis?
How the analysis handles non-compliance depends on the question we want to answer. Adapted from Chapter 10.
Slide 8How we analyze the data in the face of non-compliance depends on the question we want to answer. There are three analyses, and each one answers a different question.
Intention-to-treat
Intention-to-treat estimates the effect of offering the intervention
Everyone stays in their randomized group, whatever they actually did
Preserves the benefits of randomization
The standard primary analysis, and it should always be reported
Slide 9Intention-to-treat analysis keeps participants in their randomized group regardless of what they actually did. Someone randomized to the intervention who never showed up? Still analyzed as intervention. That preserves the benefits of randomization, and it answers a policy-relevant question: what happens when we offer this intervention to a population, knowing that real-world uptake will be imperfect? It's conservative, but intention-to-treat is the standard primary analysis for RCTs and should always be reported.
Per-protocol
Per-protocol analysis, and why adherers differ
Only participants who received the intervention as intended
Adherers tend to be healthier, more motivated, better supported
So it can introduce selection bias
Slide 10Per-protocol analysis restricts to participants who actually received the intervention as intended, and control participants who didn't cross over. It answers a different question: what is the effect in people who actually adhere? The problem is that adherers differ systematically from non-adherers. They tend to be healthier, more motivated, and to have better social support. So per-protocol analysis can introduce selection bias, even though it seems to answer a more clinically relevant question.
CACE
The complier average causal effect uses randomization as an instrument
Assignment affects the outcome only through receiving treatment
Recovers a causal estimate for compliers, not for everyone
Report intention-to-treat first; the others as supplementary
Slide 11Complier average causal effect analysis, sometimes called the treatment effect on the treated, uses instrumental variables to estimate the effect of actually receiving the intervention among people who would comply if offered it. Unlike per-protocol analysis, it accounts for the fact that compliance isn't random. It uses randomization itself as the instrument: being assigned to the treatment arm only affects your outcome through receiving treatment, if you're a complier. It recovers a causal estimate, but only for the subpopulation of compliers. Most RCTs should report intention-to-treat as the primary analysis, with per-protocol and, where relevant, the complier average causal effect as supplementary analyses. Together they tell a more complete story than any single approach.
Spillover
When one person’s treatment affects another person’s outcome
Deworming one child reduces transmission to nearby children
Vaccinating enough people creates herd immunity
Health information shared with one household spreads
Slide 12Spillover is one of the most underappreciated complications in trial design. It occurs when the treatment given to one person affects the outcomes of another person who wasn't treated. From a public health perspective, spillover is often the whole point. We want deworming one child to reduce transmission to nearby children. We want vaccinating enough people to create herd immunity. We want health information shared with one household to spread through a community.
Miguel & Kremer, 2004
School-based deworming in Kenya
Untreated children in treated schools experienced health gains
So did children in nearby untreated schools
Through reduced transmission
Slide 13The classic example is a study of school-based deworming in Kenya, which found that untreated children in treated schools, and even children in nearby untreated schools, experienced health gains from reduced transmission.
SUTVA
Spillover violates SUTVA and shrinks the estimated effect
Stable unit treatment value assumption: one person’s treatment doesn’t affect another’s outcome
Spillover can be biological, informational, or behavioral
The comparison group is also benefiting
Slide 14Spillover complicates research because it violates the stable unit treatment value assumption, or SUTVA: the assumption that one person's treatment status doesn't affect another person's outcome. Spillover can be biological, informational, or behavioral. If the control group is also benefiting from the intervention, it isn't really untreated, and our estimated treatment effect shrinks because the comparison group is also benefiting.
Cluster randomization
Why we randomize clusters
The intervention is delivered at the group level
Spillover between individuals is likely
Individual randomization is impossible or culturally inappropriate
Slide 15This is why cluster randomization helps. We randomize groups when the intervention is delivered at the group level, when spillover between individuals is likely, or when individual randomization would be logistically impossible or culturally inappropriate. By randomizing entire villages or schools, we create a buffer between treatment and control groups. Spillover still happens within clusters, but it's less likely to cross between clusters, especially when they're geographically separated. We can also design studies to measure spillover directly, by comparing untreated people who are near treated clusters with those who are far from them.
Intracluster correlation (ICC)
How similar are people within the same cluster?
Children in the same school share teachers, meals, and exposures
ICC of 1: every person in a cluster is a clone; effective sample size is 1
ICC of 0: clustering costs nothing statistically
Slide 16Cluster randomization solves the spillover problem, but it introduces a statistical one. People within the same cluster tend to be more similar to each other than to people in different clusters. That similarity is captured by the intracluster correlation coefficient, or ICC, and it means that adding more people from the same cluster gives us less new information than adding people from different clusters. To build intuition, imagine every person in a cluster is an identical clone. Once we've measured one clone's response to treatment, measuring a second tells us nothing new, so the effective sample size is 1. That's an ICC of 1. If people within clusters are no more similar to each other than to people in other clusters, the ICC is 0, and clustering doesn't cost us anything. Reality falls somewhere in between, and even modest ICCs can dramatically inflate the sample size we need.
An ICC of 0.05 with 50 children per school
Design effect = 1 + (50 − 1) × 0.05 = 3.45
We need 3.45 times as many participants as an individually randomized trial
Slide 17Suppose we're testing a school-based nutrition program and the outcome is child height. If the ICC is 0.05, meaning 5% of the variation in height is between schools, and there's an average of 50 children per school, the design effect is 3.45. We'd need 3.45 times as many participants in a cluster trial as in an individually randomized trial to achieve the same statistical power.
The same total sample, with and without clustering
Both curves assume 80% power, alpha = 0.05, and an outcome SD of 10. The cluster design assumes 50 participants per cluster and an ICC of 0.05. Reproduced from Chapter 10.
Slide 18This figure shows how quickly that adds up. With the same total sample size, a cluster trial can detect much less than an individual trial.
In Closing
Plan for clustering in the sample size calculation
Ignoring it leads to underpowered studies and inflated Type I error
Slide 19This is why cluster trials require many more participants than individual trials, and why we need to plan for clustering during the sample size calculation. Ignoring clustering leads to underpowered studies and inflated Type I error rates. In the next video, we'll see a cluster design in which every cluster eventually receives the intervention.