Chapter 7 · Video 3
Confounder control and drawing your assumptions
Print layout
Slide 1


Confounder control and drawing your assumptions
Slide 2
Ice cream sales and violent crime rise together
In the data alone, one looks like it could be causing the other
Both are more common when the weather is warm
Control for weather, and the relationship disappears
Slide 3
Find and adjust for a sufficient set of variables
Results from non-experimental contexts are at high risk of confounding
That is the goal of confounder-control studies
Slide 4
Pearl and Mackenzie, 2018
Data are profoundly dumb
A dataset cannot tell you which variables to adjust for
It cannot tell you what is a cause and what is an effect
You need causal models informed by domain expertise
Slide 5
Pearl, 1995
The causal directed acyclic graph, or DAG
A graphical approach to causal inference in confounder-control studies
The most common graphical model you'll encounter
Used elsewhere too, but this is where you see them most
Slide 6
A DAG for the road less traveled and happiness
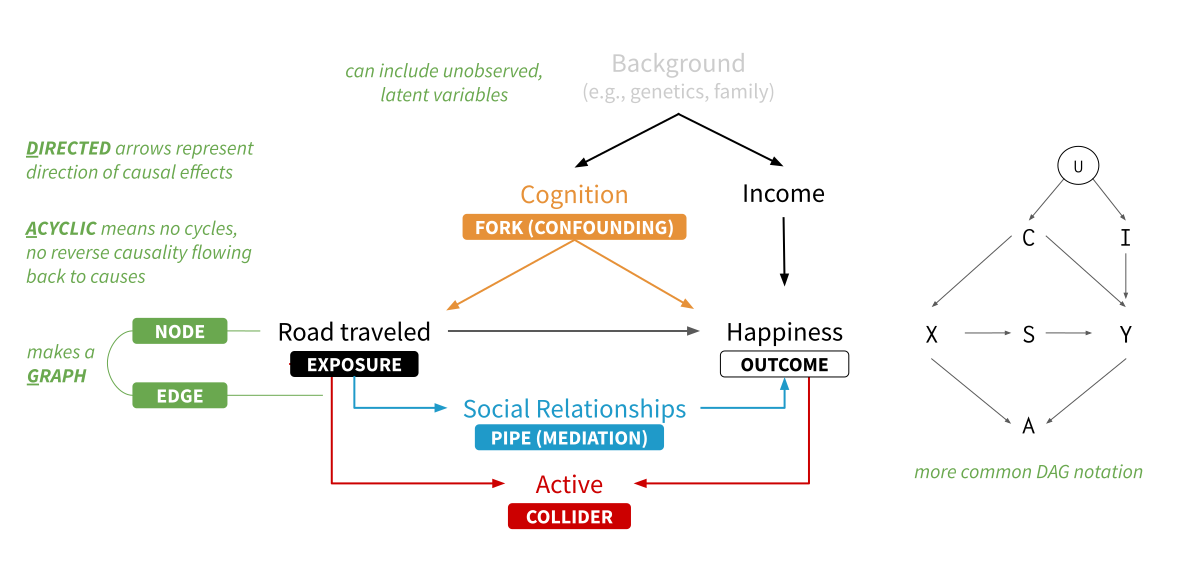
Causal directed acyclic graph (DAG) of the effect of taking the road less traveled on happiness. Reproduced from Chapter 7.
Slide 7
Cunningham, 2021
A DAG is a story about what causes what
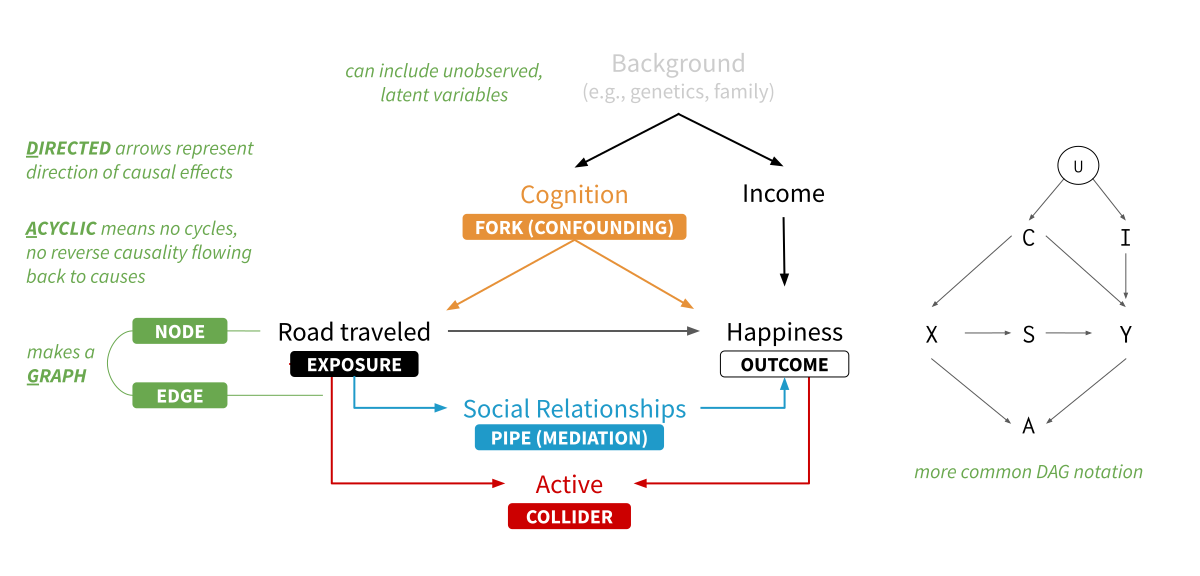
The road traveled causes happiness directly and through social relationships. Cognition is a common cause of both. Income also follows from background characteristics. Reproduced from Chapter 7.
Slide 8
Drawing the assumptions is already an accomplishment
The DAG represents a belief about the data generating process
It holds every node and connection believed to be relevant
Assumptions are now clear, and identification can proceed
Slide 9
You can draw a different DAG, and defend it
A different DAG can imply a different analysis strategy
Be open to modification based on subject matter criticism
There is no escaping the need to make assumptions
Slide 10
Nodes are the variables
The exposure of interest and the outcome of interest are both nodes
Discrete values like road traveled, continuous values like income
Observed and unobserved variables both belong, including genetics
Slide 11
Every edge is a causal statement
An arrow from road traveled to happiness asserts that one causes the other
Arrows carry no sign — positive or negative is not shown
The absence of an arrow implies there is no causal relationship
Slide 12
The only hard rule: no cycles
Arrows can go into and out of a node
No recursive pathways — happiness cannot loop back to its own cause
Causal effects must only flow forward in time
Slide 13
McElreath, 2020 · Structure 1 of 3
Forks: a common cause of both variables
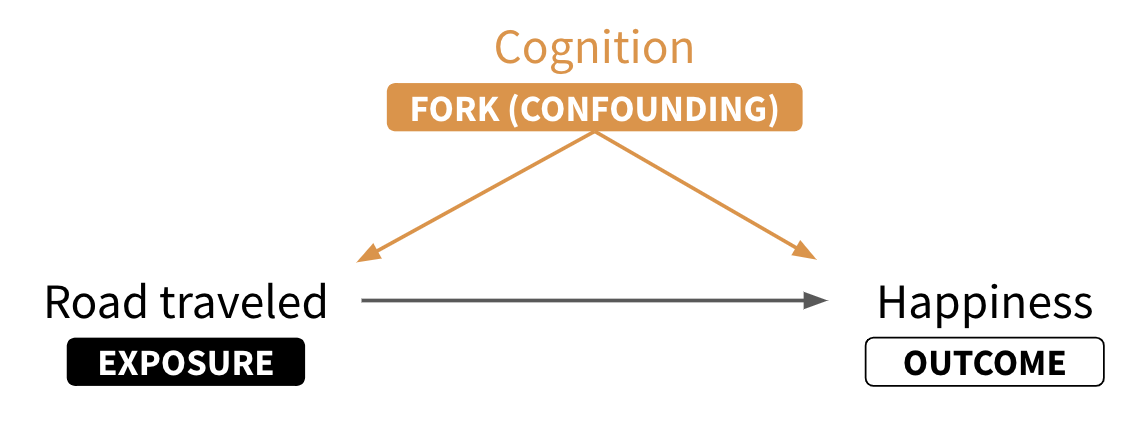
A fork. Cognition causes both the road traveled and happiness, so it confounds the effect of one on the other. Reproduced from Chapter 7.
Slide 14
Structure 2 of 3
Pipes: an indirect causal chain through a mediator
road traveled → social relationships → happiness
The total effect includes the direct effect and the mediated ones
Sometimes the mechanism itself is the aim of the study
Slide 15
Structure 3 of 3
Colliders: a node with only incoming arrows
road traveled → active lifestyle ← happiness
Closed by default, so nothing flows along the path
Conditioning on it opens the path and distorts the relationship
Slide 16
U.S. Joint Chiefs of Staff
You must include all the relevant nodes and paths
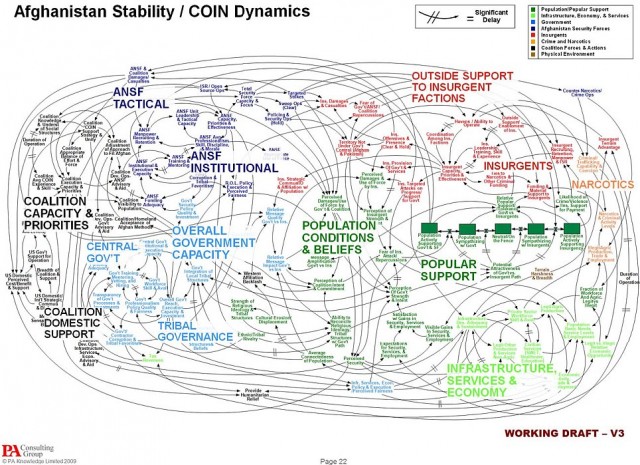
War is hard. Source: U.S. Joint Chiefs of Staff. (Not a DAG, per se, but you get the point.) Reproduced from Chapter 7.
Slide 17
Huntington-Klein, 2021
DAG creation is a balancing act
Omit every variable and arrow you can possibly get away with
The simpler the diagram, the easier it is to identify an answer
The real world is complex, and simplicity can drop something important
Slide 18
Rohrer, 2018
Add a node only if it affects two or more existing nodes
Start from a basic DAG
Being left handed might contribute to the road you take
With no arrow into any other node, it can safely be left out
Slide 19
In Closing
If this feels daunting, you're doing it right
At best, your study will approximate the truth
There is a very good chance your DAG is wrong or incomplete
Criticism should lead you to revise it, or to defend it better
Confounder control and drawing your assumptions
Slide 1Confounding is a type of bias where variables X and Y share a common cause, Z, that explains some or all of the relationship between X and Y. You're likely familiar with examples of confounding like ice cream sales and violent crime.
Ice cream sales and violent crime rise together
In the data alone, one looks like it could be causing the other
Both are more common when the weather is warm
Control for weather, and the relationship disappears
Slide 2If you look just in the data, it looks like increases in ice cream sales could be causing increases in violent crime, or maybe the other way around. But this is what we call a spurious correlation. Ice cream sales and violent crime are both more common when the weather is warm. Once you statistically control for weather, let's say by looking just at sales on hot days, there is no relationship between ice cream sales and crime.
Find and adjust for a sufficient set of variables
Results from non-experimental contexts are at high risk of confounding
That is the goal of confounder-control studies
Slide 3Causal relationships observed in non-experimental contexts are at high risk of confounding, and the goal of confounder-control studies is to find and statistically adjust for a sufficient set of variables to eliminate confounding.
Pearl and Mackenzie, 2018
Data are profoundly dumb
A dataset cannot tell you which variables to adjust for
It cannot tell you what is a cause and what is an effect
You need causal models informed by domain expertise
Slide 4That takes more than statistics, because data are profoundly dumb. A dataset cannot tell you which variables to adjust for, or what is a cause and what is an effect. For that you need information that lives outside of statistical models. You need causal models that are informed by domain expertise.
Pearl, 1995
The causal directed acyclic graph, or DAG
A graphical approach to causal inference in confounder-control studies
The most common graphical model you'll encounter
Used elsewhere too, but this is where you see them most
Slide 5For this reason, a graphical approach based on causal diagrams has emerged as a popular tool for causal inference in confounder-control studies. The most common type of graphical model you'll encounter is the causal directed acyclic graph, or DAG. Causal diagrams turn up outside confounder-control work as well, but this is where you see them used most often.
A DAG for the road less traveled and happiness
Causal directed acyclic graph (DAG) of the effect of taking the road less traveled on happiness. Reproduced from Chapter 7.
Slide 6Here is an example DAG of the effect of taking the road less traveled on happiness. As a graph, a DAG consists of nodes and edges. The nodes are the variables, and the edges are the arrows between them. Each arrow makes a causal statement.
Cunningham, 2021
A DAG is a story about what causes what
The road traveled causes happiness directly and through social relationships. Cognition is a common cause of both. Income also follows from background characteristics. Reproduced from Chapter 7.
Slide 7DAGs have been framed as storytelling devices. The story I am telling with this DAG is that the road traveled causes happiness directly, and indirectly, by creating new social relationships. This DAG also shows my assumption that happiness and the decision to take the road less traveled are both caused in part by one's cognitive style, for example a sense of optimism. They share a common cause. Happiness is also caused by income which, like cognition, is a function of background characteristics like genetics and family.
Drawing the assumptions is already an accomplishment
The DAG represents a belief about the data generating process
It holds every node and connection believed to be relevant
Assumptions are now clear, and identification can proceed
Slide 8Before I even do anything with this DAG, or any DAG I create, I've accomplished a lot just by drawing my assumptions. The DAG represents my belief in the data generating process. It includes all nodes and connections that I believe are relevant to the effect of road traveled on happiness. I've made my assumptions clear and can proceed to identify how I will estimate the causal effect of interest.
You can draw a different DAG, and defend it
A different DAG can imply a different analysis strategy
Be open to modification based on subject matter criticism
There is no escaping the need to make assumptions
Slide 9Now you might call bull, and that's OK. You can draw a different DAG that might have different implications for the best analysis strategy. You and I should be able to defend our assumptions and be open to modifications based on subject matter criticism. But whether you draw a DAG or not, there is no escaping the need to make assumptions. DAGs just help to make your assumptions clear and transparent.
Nodes are the variables
The exposure of interest and the outcome of interest are both nodes
Discrete values like road traveled, continuous values like income
Observed and unobserved variables both belong, including genetics
Slide 10As a graph, DAGs consist of nodes and edges, or arrows. Nodes are variables, like our exposure of interest, the road traveled, and our outcome of interest, happiness later in life. Nodes can take any form, from discrete values of road traveled, more traveled or less traveled, to continuous values of income. A DAG can include observed, measured variables and unobserved variables, including background factors such as genetics.
Every edge is a causal statement
An arrow from road traveled to happiness asserts that one causes the other
Arrows carry no sign — positive or negative is not shown
The absence of an arrow implies there is no causal relationship
Slide 11Nodes are connected by edges, directed arrows that make causal statements about how two variables are related. For instance, by drawing an arrow from road traveled to happiness, I'm asserting that the road one travels causes happiness. Arrows do not indicate whether this relationship is positive or negative, just that road traveled influences happiness. Equivalently, the absence of an arrow between nodes implies that there is no causal relationship.
The only hard rule: no cycles
Arrows can go into and out of a node
No recursive pathways — happiness cannot loop back to its own cause
Causal effects must only flow forward in time
Slide 12The only hard rule in a DAG is that cycles are not permitted. Arrows can go into and out of a node, but there must not be any recursive pathways. Social relationships causing happiness, and happiness causing social relationships back again, is not allowed. Causal effects must only flow forward in time.
McElreath, 2020 · Structure 1 of 3
Forks: a common cause of both variables
A fork. Cognition causes both the road traveled and happiness, so it confounds the effect of one on the other. Reproduced from Chapter 7.
Slide 13There are three possible relationship structures in a DAG, and the first is a fork. In a fork, like the one on screen, where cognition points to both road traveled and happiness, cognition is a common cause of the two focal variables of interest. So cognition confounds the causal effect of road traveled on happiness. Some, or all, of the observed association is due to cognition. When you see a fork, you should think confounding.
Structure 2 of 3
Pipes: an indirect causal chain through a mediator
road traveled → social relationships → happiness
The total effect includes the direct effect and the mediated ones
Sometimes the mechanism itself is the aim of the study
Slide 14The second structure is a pipe. Pipes, or chains, involve mediator variables like social relationships that represent an indirect causal chain of effects. Road traveled causes new social relationships, which cause happiness. Whether or not you are interested in the indirect causal effect depends on your research question. Often we care about the total causal effect, which includes the direct effect and all the indirect, mediated effects. Sometimes, however, an aim of a study will be to understand possible mechanisms of action that involve mediated pathways.
Structure 3 of 3
Colliders: a node with only incoming arrows
road traveled → active lifestyle ← happiness
Closed by default, so nothing flows along the path
Conditioning on it opens the path and distorts the relationship
Slide 15The third structure is a collider. Colliders, or inverted forks, are closed pathways, like road traveled pointing to an active lifestyle and happiness also pointing to an active lifestyle, where a node on the pathway only has incoming arrows. These pathways are closed by default, and they only open when you condition on the collider, which distorts the relationship between road traveled and happiness. As you will see shortly, being able to recognize these three relationships will help you to identify your causal effect of interest.
U.S. Joint Chiefs of Staff
You must include all the relevant nodes and paths
War is hard. Source: U.S. Joint Chiefs of Staff. (Not a DAG, per se, but you get the point.) Reproduced from Chapter 7.
Slide 16In order to use a DAG to identify a causal effect, you must include all of the relevant nodes and paths. As you can probably imagine, this can get out of hand quickly. Just look at this slide, which diagrams the American military's perceived challenge in its war in Afghanistan. War is hard, and so is drawing everything that matters.
Huntington-Klein, 2021
DAG creation is a balancing act
Omit every variable and arrow you can possibly get away with
The simpler the diagram, the easier it is to identify an answer
The real world is complex, and simplicity can drop something important
Slide 17DAG creation has been framed as a balancing act. On one hand, we want to omit from the diagram every variable and arrow we can possibly get away with. The simpler the diagram is, the easier it is to understand, and the more likely it is that we'll be able to figure out how to identify the answer to our research question. On the other hand, omitting things makes the model simpler, and the real world is complex. So in our quest for simplicity, we might end up leaving out something that's really important.
Rohrer, 2018
Add a node only if it affects two or more existing nodes
Start from a basic DAG
Being left handed might contribute to the road you take
With no arrow into any other node, it can safely be left out
Slide 18A piece of practical advice is to draw a basic DAG and then add additional variables, or nodes, only if you believe they causally affect two or more existing nodes in the DAG. For instance, maybe you could argue that being left handed also contributes to one's decision to take the road less traveled. If handedness does not have an arrow into any other nodes, you can safely leave it out of the DAG.
In Closing
If this feels daunting, you're doing it right
At best, your study will approximate the truth
There is a very good chance your DAG is wrong or incomplete
Criticism should lead you to revise it, or to defend it better
Slide 19If this feels daunting, you're doing it right. Science is hard, and I predict that you'll find this process easier if you have the humility to know that, at best, your study will approximate the truth. There is a very good chance that your DAG will be wrong or incomplete. Your colleagues might tell you as much. This is part of the scientific process. Criticism should lead you to revise your DAG or strengthen how you defend your assumptions.