Chapter 12 · Video 2
Cross-sectional studies and the problem of timing
Print layout
Slide 1


Cross-sectional studies and the problem of timing
Slide 2
Worked example
An alert for bloody diarrhea in three villages in rural Tanzania
Community health workers report an uptick over two weeks
The surveillance system flags it as above the expected threshold for dysentery
A rapid response team investigates
Slide 3
Worked example
What the case series of 47 children showed
85% of cases are children under five
Cases cluster in households along one side of a river
Most affected children drank from one community well
Onset dates suggest the outbreak began about ten days ago
Slide 4
Worked example
Each hypothesis points to a different design
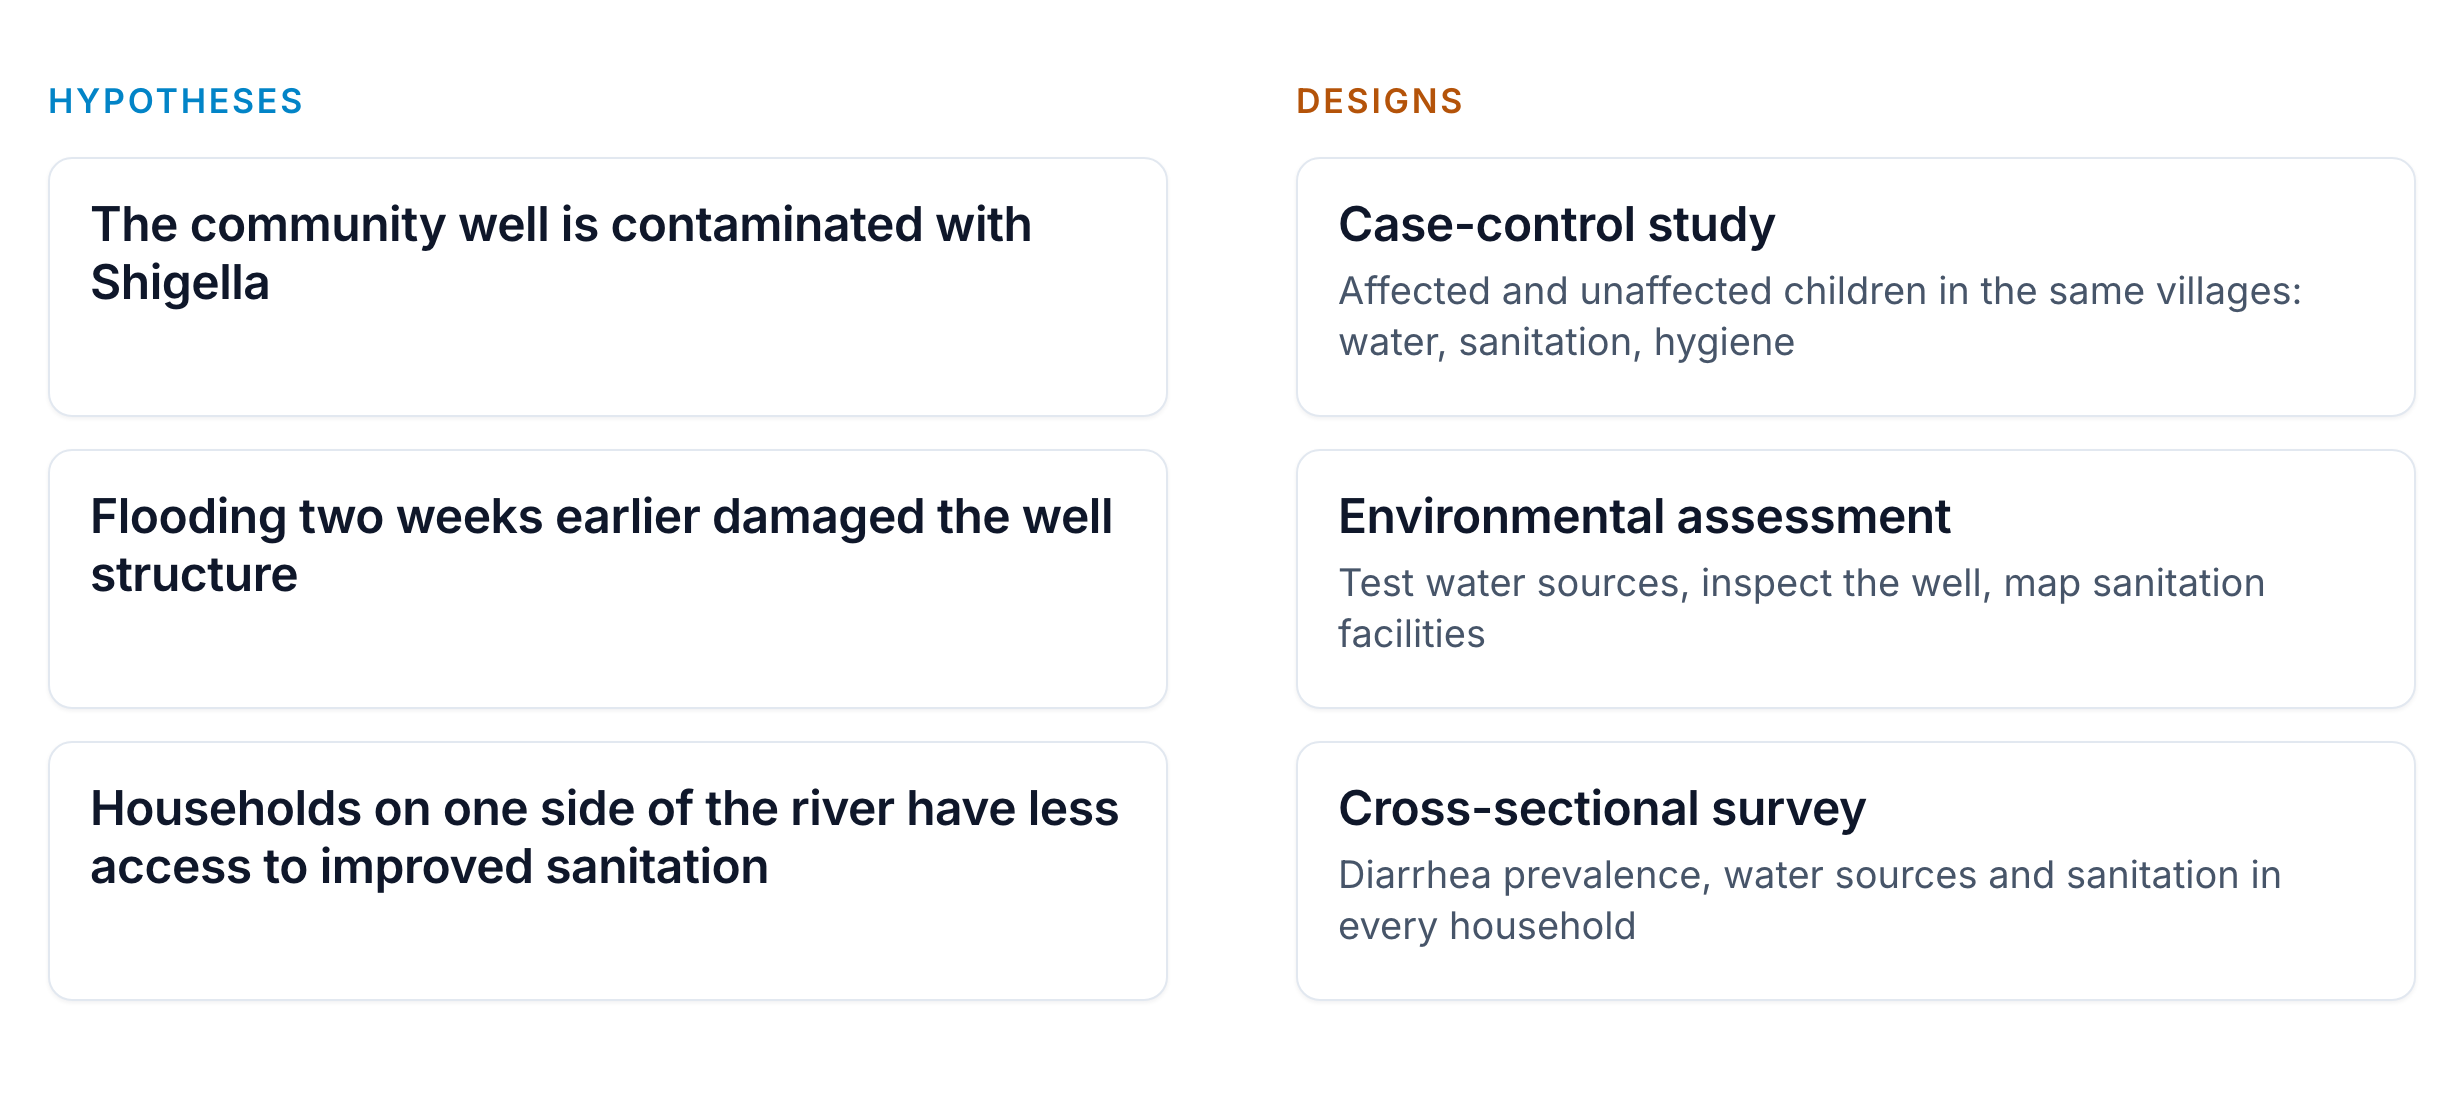
Hypotheses generated by the case series, and the analytical designs that could test them. A hypothetical outbreak.
Slide 5
Worked example
From a surveillance alert to a decommissioned well
The case-control study links the well to much higher odds of dysentery
Environmental testing confirms Shigella in the well
The survey shows households without latrines cluster near it
Slide 6
Cross-sectional studies
Exposure and outcome measured at the same point in time
Relatively quick and cheap
No need to follow anyone over time
Slide 7
Gebremedhin et al., 2021
Fewer than one in five mothers in Ethiopia's pastoral regions practiced exclusive breastfeeding
17.6% (95% CI 15.6 to 19.6) in the 2016 Demographic and Health Survey
With significant variation by region
Captured in a single survey round
Slide 8
What cross-sectional studies are good for
Estimating prevalence
Identifying associations
Assessing population health status for planning
Generating hypotheses worth investigating with stronger designs
Slide 9
Which came first, the depression or the inactivity?
Plausible: depression reduces motivation to exercise
Also plausible: lack of exercise leads to depression
Also plausible: some third factor, like chronic illness or socioeconomic stress, causes both
Slide 10
Definition
Prevalence and incidence
Prevalence
Have the condition at one time point
150 of 1,000 surveyed adults
15%, a snapshot
Incidence
New cases over a specified period
85 of 850 healthy adults in a year
10 cases per 100 person-years
Slide 11
Prevalence depends on incidence and on duration
Slow to develop and long-lasting, like diabetes: high prevalence relative to incidence
Quick to develop and quick to resolve, like colds: low prevalence relative to incidence
Slide 12
In Closing
Measuring incidence requires following people over time
Cross-sectional studies naturally measure prevalence
Incidence needs longitudinal follow-up, which is where cohort studies come in
Cross-sectional studies and the problem of timing
Slide 1Surveillance tells us that something unusual is happening. To see how surveillance data can move from describing a problem to testing hypotheses about its causes, let's trace a hypothetical outbreak.
Worked example
An alert for bloody diarrhea in three villages in rural Tanzania
Community health workers report an uptick over two weeks
The surveillance system flags it as above the expected threshold for dysentery
A rapid response team investigates
Slide 2Suppose a district health office in rural Tanzania notices an uptick in bloody diarrhea cases reported by community health workers over a two-week period. The surveillance system flags it as exceeding the expected threshold for dysentery, and a rapid response team investigates. Say they document 47 cases across three villages.
Worked example
What the case series of 47 children showed
85% of cases are children under five
Cases cluster in households along one side of a river
Most affected children drank from one community well
Onset dates suggest the outbreak began about ten days ago
Slide 3The case series might show that 85% of cases are children under five, that cases cluster in households along one side of a river, that most affected children drank water from a specific community well, and that onset dates suggest the outbreak started about ten days ago.
Worked example
Each hypothesis points to a different design
Hypotheses generated by the case series, and the analytical designs that could test them. A hypothetical outbreak.
Slide 4The clustering and the water source generate testable hypotheses. The community well might be contaminated with Shigella. Contamination might have resulted from flooding two weeks earlier that damaged the well. Households on the affected side of the river might have less access to improved sanitation. Each hypothesis points to a different analytical design. A case-control study could compare affected children to unaffected children in the same villages. An environmental assessment could test the suspect well and map sanitation facilities. And a cross-sectional survey could assess diarrhea, water sources, and sanitation across every household.
Worked example
From a surveillance alert to a decommissioned well
The case-control study links the well to much higher odds of dysentery
Environmental testing confirms Shigella in the well
The survey shows households without latrines cluster near it
Slide 5Suppose the team does all three. The case-control study establishes that drinking from the suspect well dramatically increased the odds of dysentery. Environmental testing confirms Shigella in the well. The cross-sectional survey shows that households without latrines cluster near it. The well is decommissioned, households receive water purification tablets, a latrine program begins, and surveillance continues to confirm the outbreak has ended. That's the progression from noticing unusual cases, to generating hypotheses, to testing specific causal claims, to action.
Cross-sectional studies
Exposure and outcome measured at the same point in time
Relatively quick and cheap
No need to follow anyone over time
Slide 6The first of those analytical designs we'll look at is the cross-sectional study. Imagine we walk into a village and measure everyone's height, weight, blood pressure, and malaria status on the same day. That's a cross-sectional study: exposure and outcome measured at the same point in time. Cross-sectional studies are workhorses in global health because they're relatively quick and cheap. We don't need to follow anyone over time.
Gebremedhin et al., 2021
Fewer than one in five mothers in Ethiopia's pastoral regions practiced exclusive breastfeeding
17.6% (95% CI 15.6 to 19.6) in the 2016 Demographic and Health Survey
With significant variation by region
Captured in a single survey round
Slide 7A single wave of a national survey can reveal stark regional inequalities. An analysis of the 2016 Ethiopian Demographic and Health Survey found that fewer than one in five mothers, 17.6%, in the pastoral emerging regions practiced exclusive breastfeeding, with significant variation by region. Differences like these, captured in a single survey round, are the kind of information needed to target interventions where they'll have the greatest impact.
What cross-sectional studies are good for
Estimating prevalence
Identifying associations
Assessing population health status for planning
Generating hypotheses worth investigating with stronger designs
Slide 8Cross-sectional studies excel at estimating prevalence, identifying associations, assessing population health for planning, and generating hypotheses worth investigating with stronger designs. But there's a fundamental problem with cross-sectional studies for causal inference, and it's all about timing.
Which came first, the depression or the inactivity?
Plausible: depression reduces motivation to exercise
Also plausible: lack of exercise leads to depression
Also plausible: some third factor, like chronic illness or socioeconomic stress, causes both
Slide 9In our session on causal inference, we said that temporality is essential for causation. The cause has to come before the effect. But in a cross-sectional study, we measure everything at once. Say we find that people with depression are less physically active. Depression might reduce motivation to exercise. Lack of exercise might lead to depression. Or some third factor, like chronic illness or socioeconomic stress, might cause both. Which came first, the depression or the inactivity? Without the temporal sequence, we can't make causal claims. We can only describe associations.
Definition
Prevalence and incidence
Prevalence
Have the condition at one time point
150 of 1,000 surveyed adults
15%, a snapshot
Incidence
New cases over a specified period
85 of 850 healthy adults in a year
10 cases per 100 person-years
Slide 10This is why cross-sectional studies often report prevalence and not incidence, and the distinction trips up many students. Prevalence is the proportion of people who have the condition at one point in time. If we survey 1,000 adults and 150 have hypertension, the prevalence is 15%. Incidence is the rate at which new cases develop over a specified period. If we follow 850 healthy adults for one year and 85 develop hypertension, the incidence is 10% per year, or more precisely, 10 cases per 100 person-years.
Prevalence depends on incidence and on duration
Slow to develop and long-lasting, like diabetes: high prevalence relative to incidence
Quick to develop and quick to resolve, like colds: low prevalence relative to incidence
Slide 11Here's why this matters. Prevalence depends on both incidence and duration. Conditions that develop slowly but last a long time, like diabetes, have high prevalence relative to incidence. Conditions that develop quickly but resolve quickly, like common colds, have low prevalence relative to incidence.
In Closing
Measuring incidence requires following people over time
Cross-sectional studies naturally measure prevalence
Incidence needs longitudinal follow-up, which is where cohort studies come in
Slide 12Cross-sectional studies naturally measure prevalence. To measure incidence, we need longitudinal follow-up, and that brings us to cohort studies. First, though, we'll work backward from the outcome, with case-control studies.