Chapter 12 · Video 1
What descriptive designs can and cannot tell us
Print layout
Slide 1


What descriptive designs can and cannot tell us
Slide 2

Illustration. The first report appeared in MMWR on June 5, 1981.
Five young men with pneumonia in Los Angeles, June 1981
All previously healthy
Two had already died
Slide 3
Friedman-Kien, 1981; Hymes et al., 1981
A month later, Kaposi's sarcoma in 26 men
20 in New York City and six in California, over the previous 30 months
By September, eight more cases in young men in New York
Neither the virus nor a name for the syndrome existed yet
Slide 4
From case reports to a randomized trial
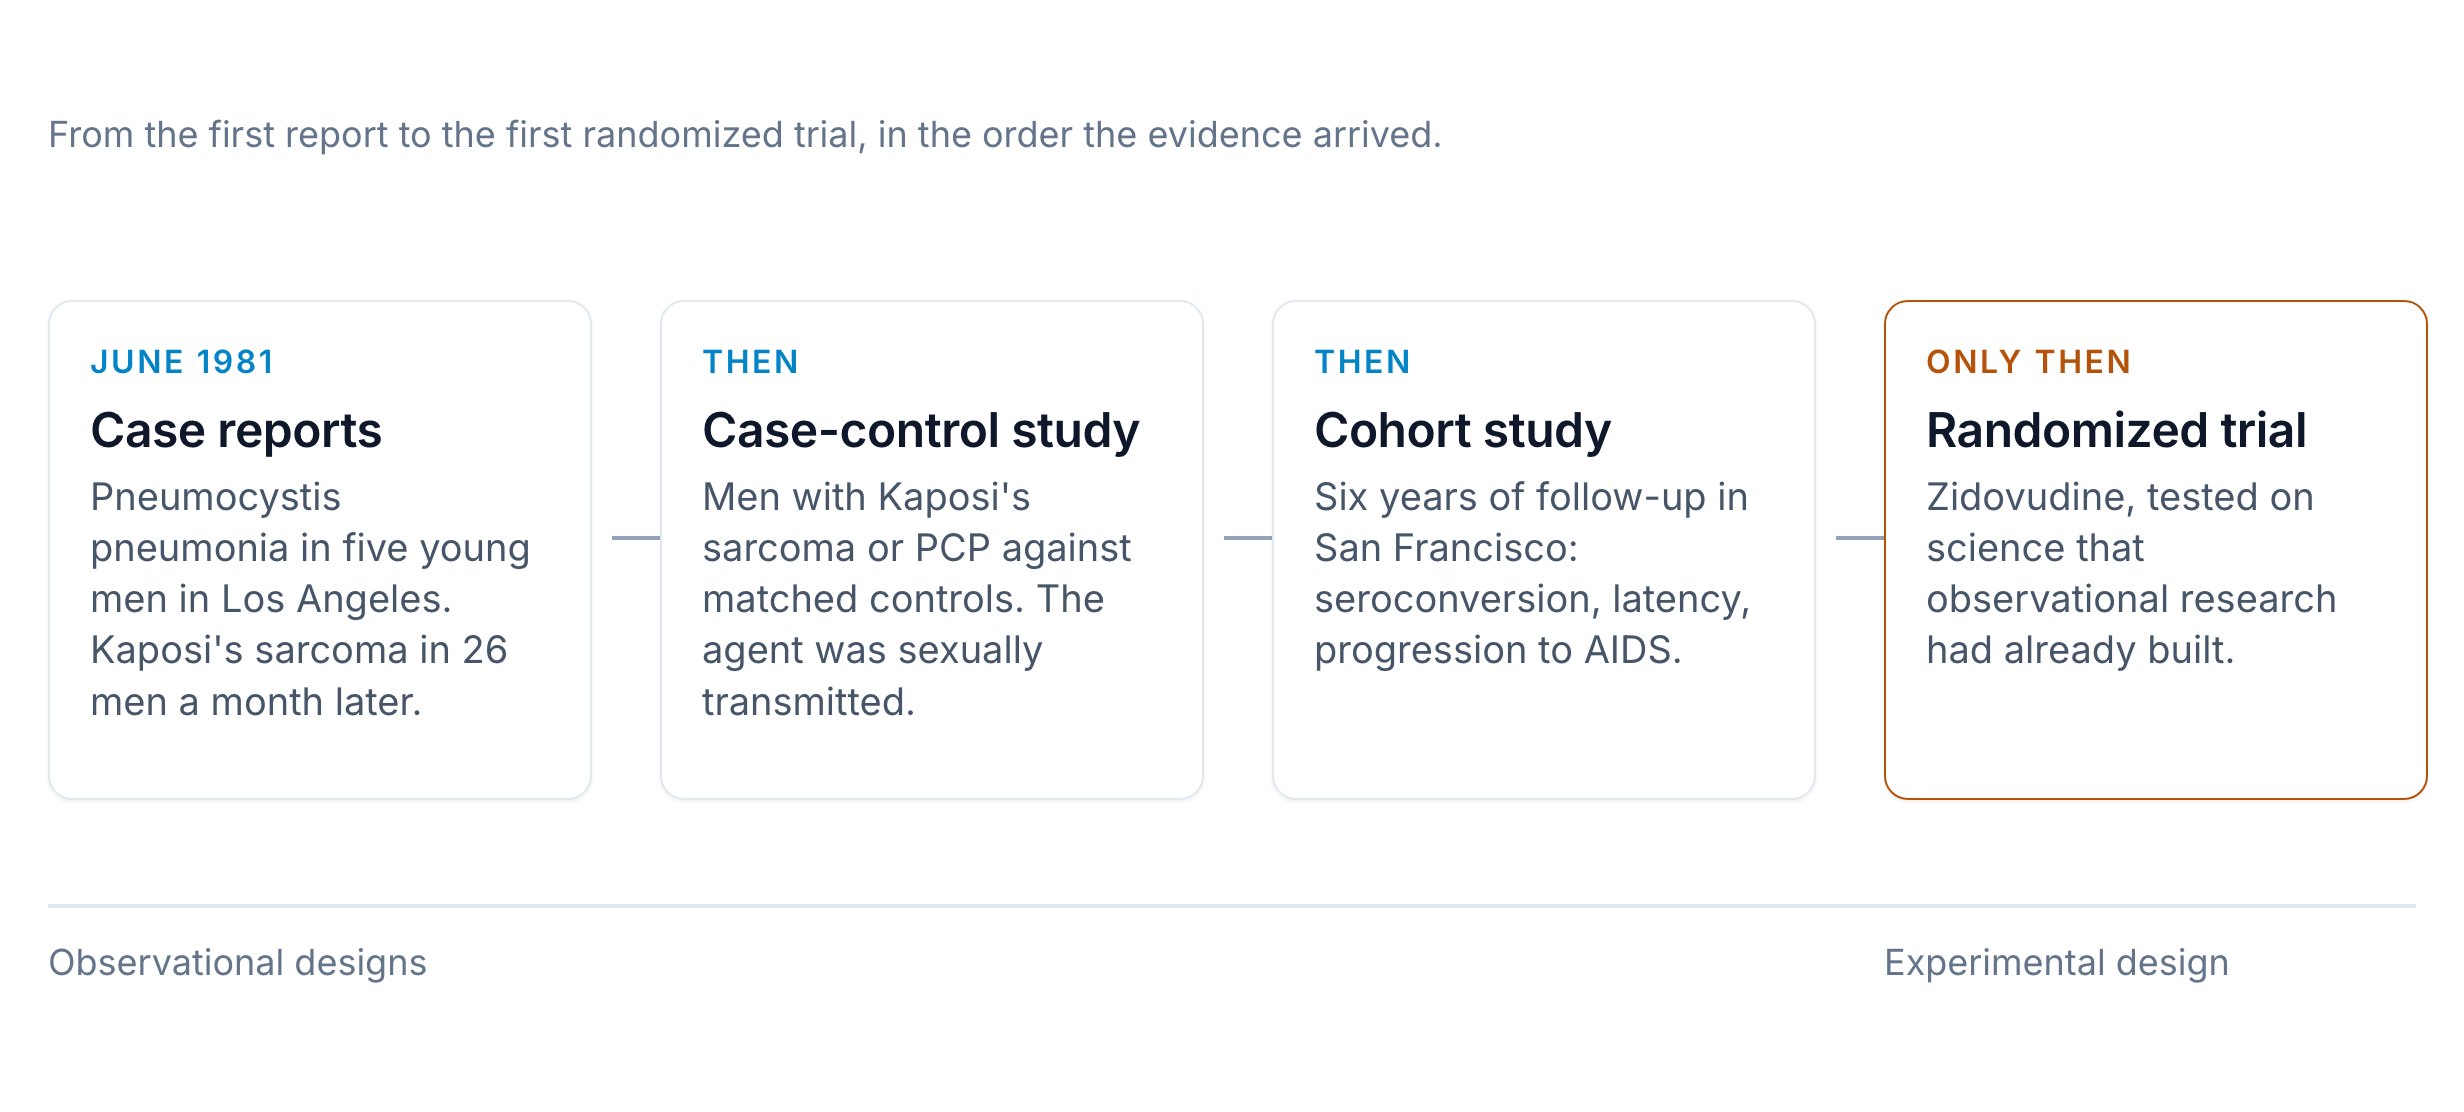
The order in which evidence about HIV arrived. Jaffe et al., 1983; Jaffe et al., 1985.
Slide 5
Observational designs are often the right tool for the question
Sometimes the only tool that is ethical, feasible, or fast enough to matter
Most global health research works this way
Slide 6
Two strategies for causal inference from non-experimental data
Confounder control
Close backdoor paths by adjustment
This chapter
Design-based approaches
Isolate exogenous variation
The quasi-experimental chapter
Slide 7
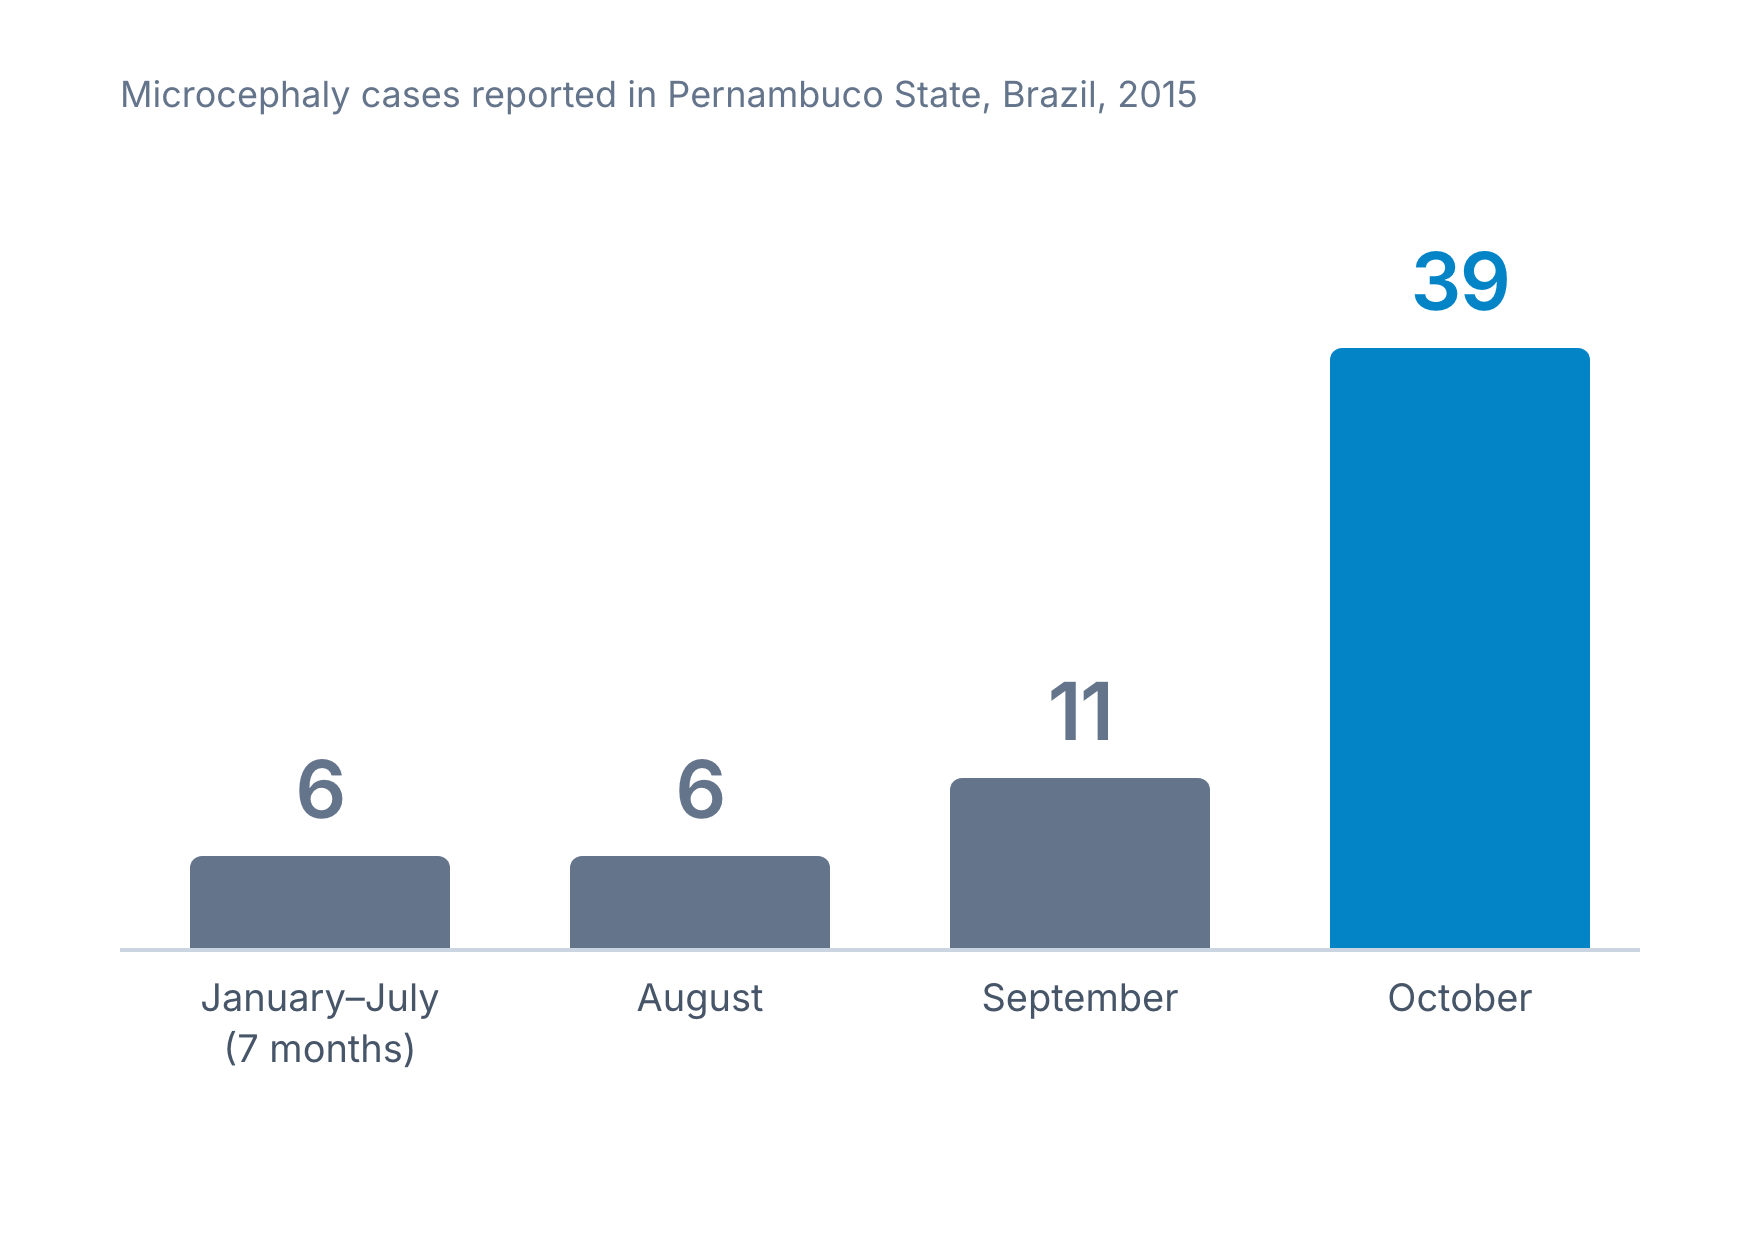
Teixeira et al., 2016. Across Brazil, 900 reports in a single week by early December.
Microcephaly in Pernambuco State, Brazil, 2015
6 cases, January–July
39 cases in October
Slide 8
Definition
Case reports describe individual patients; case series describe a group
A case series shares a characteristic, like babies born with microcephaly in one region and period
The simplest form of observational research
Slide 9
What a case series can and cannot establish
Can
Alert clinicians to new diseases
Identify rare adverse effects
Generate hypotheses
Cannot
Say how common something is
Prove causation
Rule out confounding
Slide 10
Jaenisch et al., 2017
The risk of microcephaly after Zika infection ranged from 0.03% to 3.42%
Estimated from surveillance data on live births and microcephaly notifications
About 1 of every 3,300 exposed pregnancies at the low end
About 1 of every 29 at the high end
Slide 11
Why would the risk vary so much across Brazilian states?
Differences in Zika virus strains
Co-infections with other viruses, or environmental cofactors
Differences in case ascertainment and surveillance intensity
Slide 12
Brazil responded before precise estimates were available
A national emergency, clinical protocols, and updated guidance for pregnant women
Rapid detection trumps precise estimation when time matters
Slide 13
Surveillance
Public health surveillance tracks disease in populations over time
Standardized case definitions and reporting procedures
Generates the data that makes population-level research possible
Slide 14
Swanson et al., 2018
Contact tracing during the 2014–15 Ebola virus disease crisis
Initiated for 26.7% of cases, detecting 3.6% of new cases
Contact monitoring succeeded 88% of the time
Results improved as teams learned what worked
Slide 15
Coates et al., 2013; Alhassan et al., 2024
Polio surveillance in India and IDSR across sub-Saharan Africa
Uttar Pradesh, India
Tracked paralysis and vaccination coverage
Integrated into program implementation
IDSR, sub-Saharan Africa
Community health workers as detectors
Reports flow up; action flows back down
Slide 16
In Closing
Surveillance describes what is happening, and it cannot tell us why
Continuous, population-based, standardized, and action-oriented
For why, we need analytical designs
What descriptive designs can and cannot tell us
Slide 1This chapter is about the full range of observational designs, from case reports that first raise the alarm to cohort studies that follow thousands of people over years. We'll start with the descriptive designs.
Illustration. The first report appeared in MMWR on June 5, 1981.
Five young men with pneumonia in Los Angeles, June 1981
All previously healthy
Two had already died
Slide 2On June 5, 1981, the CDC's Morbidity and Mortality Weekly Report published a brief notice about five young men in Los Angeles, all previously healthy, all hospitalized with Pneumocystis carinii pneumonia. Two of them had already died. The lead author, an immunologist at UCLA named Michael Gottlieb, had no idea what was killing them, but he knew the pattern was wrong. This was a disease of profoundly immunocompromised patients, not men in their twenties and thirties.
Friedman-Kien, 1981; Hymes et al., 1981
A month later, Kaposi's sarcoma in 26 men
20 in New York City and six in California, over the previous 30 months
By September, eight more cases in young men in New York
Neither the virus nor a name for the syndrome existed yet
Slide 3A month later, the same weekly report described a cancer that is normally rare in the United States, diagnosed in 26 homosexual men, 20 of them in New York City and six in California, over the previous 30 months. By September, The Lancet had described eight more cases in New York. Neither the virus nor a name for the syndrome existed yet. The alarm had been sounded by physicians paying attention and documenting what they observed.
From case reports to a randomized trial
The order in which evidence about HIV arrived. Jaffe et al., 1983; Jaffe et al., 1985.
Slide 4The case reports were only the start. CDC investigators then completed a case-control study comparing men with that cancer or Pneumocystis pneumonia to matched controls. They couldn't name the agent, but they could say it was sexually transmitted, and that conclusion shaped the public health response. Cohort studies took over once an antibody test became available. A six-year follow-up of men in San Francisco mapped seroconversion, latency, and progression to AIDS. By the time the first randomized trial of AZT was published, observational research had already established that HIV caused AIDS, how it spread, and who was most affected.
Observational designs are often the right tool for the question
Sometimes the only tool that is ethical, feasible, or fast enough to matter
Most global health research works this way
Slide 5Most global health research works this way. If you've been taught that randomized trials sit at the top of the evidence hierarchy, you might see observational studies as what we settle for when we can't randomize. That undersells them. Observational designs are often the right tool for the question, and sometimes the only tool that's ethical, feasible, or fast enough to matter.
Two strategies for causal inference from non-experimental data
Confounder control
Close backdoor paths by adjustment
This chapter
Design-based approaches
Isolate exogenous variation
The quasi-experimental chapter
Slide 6And despite rumors to the contrary, causal inference is very much possible with observational data. In our session on causal inference, we introduced two strategies: confounder control, which closes backdoor paths through statistical adjustment, and design-based approaches, which isolate exogenous variation. The quasi-experimental designs focus on the second. This chapter is about the first.
Teixeira et al., 2016. Across Brazil, 900 reports in a single week by early December.
Microcephaly in Pernambuco State, Brazil, 2015
6 cases, January–July
39 cases in October
Slide 7In 2015, physicians in Pernambuco State, Brazil, noticed that women were giving birth to babies with unusually small heads, a condition called microcephaly. From January to July, the state recorded 6 cases. Then it recorded 6 cases during August, 11 during September, and 39 during October. By early December, Brazil was receiving 900 reports of suspected microcephaly in a single week. This wasn't a formal study with a protocol. It was doctors recognizing a pattern that shouldn't exist, and their observations triggered Brazil's national emergency response and eventually connected the dots to Zika virus.
Definition
Case reports describe individual patients; case series describe a group
A case series shares a characteristic, like babies born with microcephaly in one region and period
The simplest form of observational research
Slide 8Case reports describe individual patients or events. Case series describe a group of patients with a shared characteristic, like babies born with microcephaly in the same region and time period. They're the simplest form of observational research, and they're valuable for exactly one thing: noticing unusual patterns and generating hypotheses.
What a case series can and cannot establish
Can
Alert clinicians to new diseases
Identify rare adverse effects
Generate hypotheses
Cannot
Say how common something is
Prove causation
Rule out confounding
Slide 9Case series alert the medical community to new diseases, identify rare adverse effects of treatments, and describe the clinical features of novel conditions. The Zika case series generated the hypothesis that the virus caused microcephaly. But case reports can't tell us how common something is, because they have no denominator. They can't prove causation, because they have no comparison group. And they can't rule out confounding. For all of that, we need different designs.
Jaenisch et al., 2017
The risk of microcephaly after Zika infection ranged from 0.03% to 3.42%
Estimated from surveillance data on live births and microcephaly notifications
About 1 of every 3,300 exposed pregnancies at the low end
About 1 of every 29 at the high end
Slide 10Researchers still needed to estimate the actual risk. Surveillance data on live births and microcephaly notifications put the risk of microcephaly after Zika infection ranged from 0.03% to 3.42% depending on the region. The high end is more than 100 times the low end. At the low end, about 1 of every 3,300 Zika-exposed pregnancies would result in microcephaly. At the high end, about 1 of every 29. If you're a pregnant woman exposed to Zika, you need to know which end of that range applies to you.
Why would the risk vary so much across Brazilian states?
Differences in Zika virus strains
Co-infections with other viruses, or environmental cofactors
Differences in case ascertainment and surveillance intensity
Slide 11The geographic variation itself became a clue. Why would risk vary so much across Brazilian states? Several hypotheses emerged: differences in virus strains, co-infections with other viruses, environmental cofactors, or even differences in case ascertainment and surveillance intensity. Each possibility required a different analytical design to investigate. That's exactly the kind of hypothesis that case series generate but can't test.
Brazil responded before precise estimates were available
A national emergency, clinical protocols, and updated guidance for pregnant women
Rapid detection trumps precise estimation when time matters
Slide 12This uncertainty spurred emergency responses well before precise estimates were available. Public health authorities declared a national emergency, developed protocols for suspected cases, and updated guidance for pregnant women. The initial case series didn't need to be perfect. It needed to be timely and credible enough to sound the alarm. When time matters in an emerging outbreak, rapid detection trumps precise estimation.
Surveillance
Public health surveillance tracks disease in populations over time
Standardized case definitions and reporting procedures
Generates the data that makes population-level research possible
Slide 13If case reports are spotting individual canaries, public health surveillance is monitoring the entire coal mine, systematically and continuously. Surveillance systems track disease occurrence in populations over time, often using standardized case definitions and reporting procedures. They're not research studies in the traditional sense, but they generate the data that makes population-level research possible.
Swanson et al., 2018
Contact tracing during the 2014–15 Ebola virus disease crisis
Initiated for 26.7% of cases, detecting 3.6% of new cases
Contact monitoring succeeded 88% of the time
Results improved as teams learned what worked
Slide 14During the 2014 to 2015 Ebola virus disease crisis, contact tracing was initiated for 26.7% of total cases, and it detected 3.6% of new cases. Contact monitoring succeeded 88% of the time, though this varied substantially between urban and rural districts. These numbers might seem modest, but they improved over time as teams learned what worked, and that learning was possible only through systematic surveillance documentation.
Coates et al., 2013; Alhassan et al., 2024
Polio surveillance in India and IDSR across sub-Saharan Africa
Uttar Pradesh, India
Tracked paralysis and vaccination coverage
Integrated into program implementation
IDSR, sub-Saharan Africa
Community health workers as detectors
Reports flow up; action flows back down
Slide 15The National Polio Surveillance Project in Uttar Pradesh, India, tracked acute flaccid paralysis cases and vaccination coverage. It was ongoing surveillance integrated into program implementation, and it contributed to India's success in eliminating wild polio. Across sub-Saharan Africa, the Integrated Disease Surveillance and Response strategy engages community health workers as frontline disease detectors, with district and national offices verifying, analyzing, and responding. When communities see that their reports lead to actual responses, they stay engaged. When they don't, the system degrades.
In Closing
Surveillance describes what is happening, and it cannot tell us why
Continuous, population-based, standardized, and action-oriented
For why, we need analytical designs
Slide 16What distinguishes surveillance from other observational designs is that it's continuous, population-based, standardized, and designed to trigger public health responses. But it shares the same fundamental limitation as case series. It describes what's happening, but it can't tell us why. For that, we need analytical designs.