Chapter 14 · Video 6
Diagnostic accuracy studies
Print layout
Slide 1


Diagnostic accuracy studies
Slide 2
Diagnostic accuracy studies
Does this person have the disease or not?
A blood smear for malaria
A chest x-ray for pneumonia
A rapid antigen test for HIV
Slide 3
Diagnostic accuracy studies
A test can miss real disease, or flag disease that isn't there
Missed disease
A person who has TB tests negative
They walk out untreated
Falsely flagged disease
A person without TB tests positive
Six months of treatment for nothing
Slide 4
Diagnostic accuracy
Sensitivity and specificity
Sensitivity
Share of sick people who test positive
90% catches 9 of every 10 sick people
Specificity
Share of healthy people who test negative
95% falsely alarms on 5 of every 100
Slide 5
Diagnostic accuracy
Every accuracy measure comes from the same table
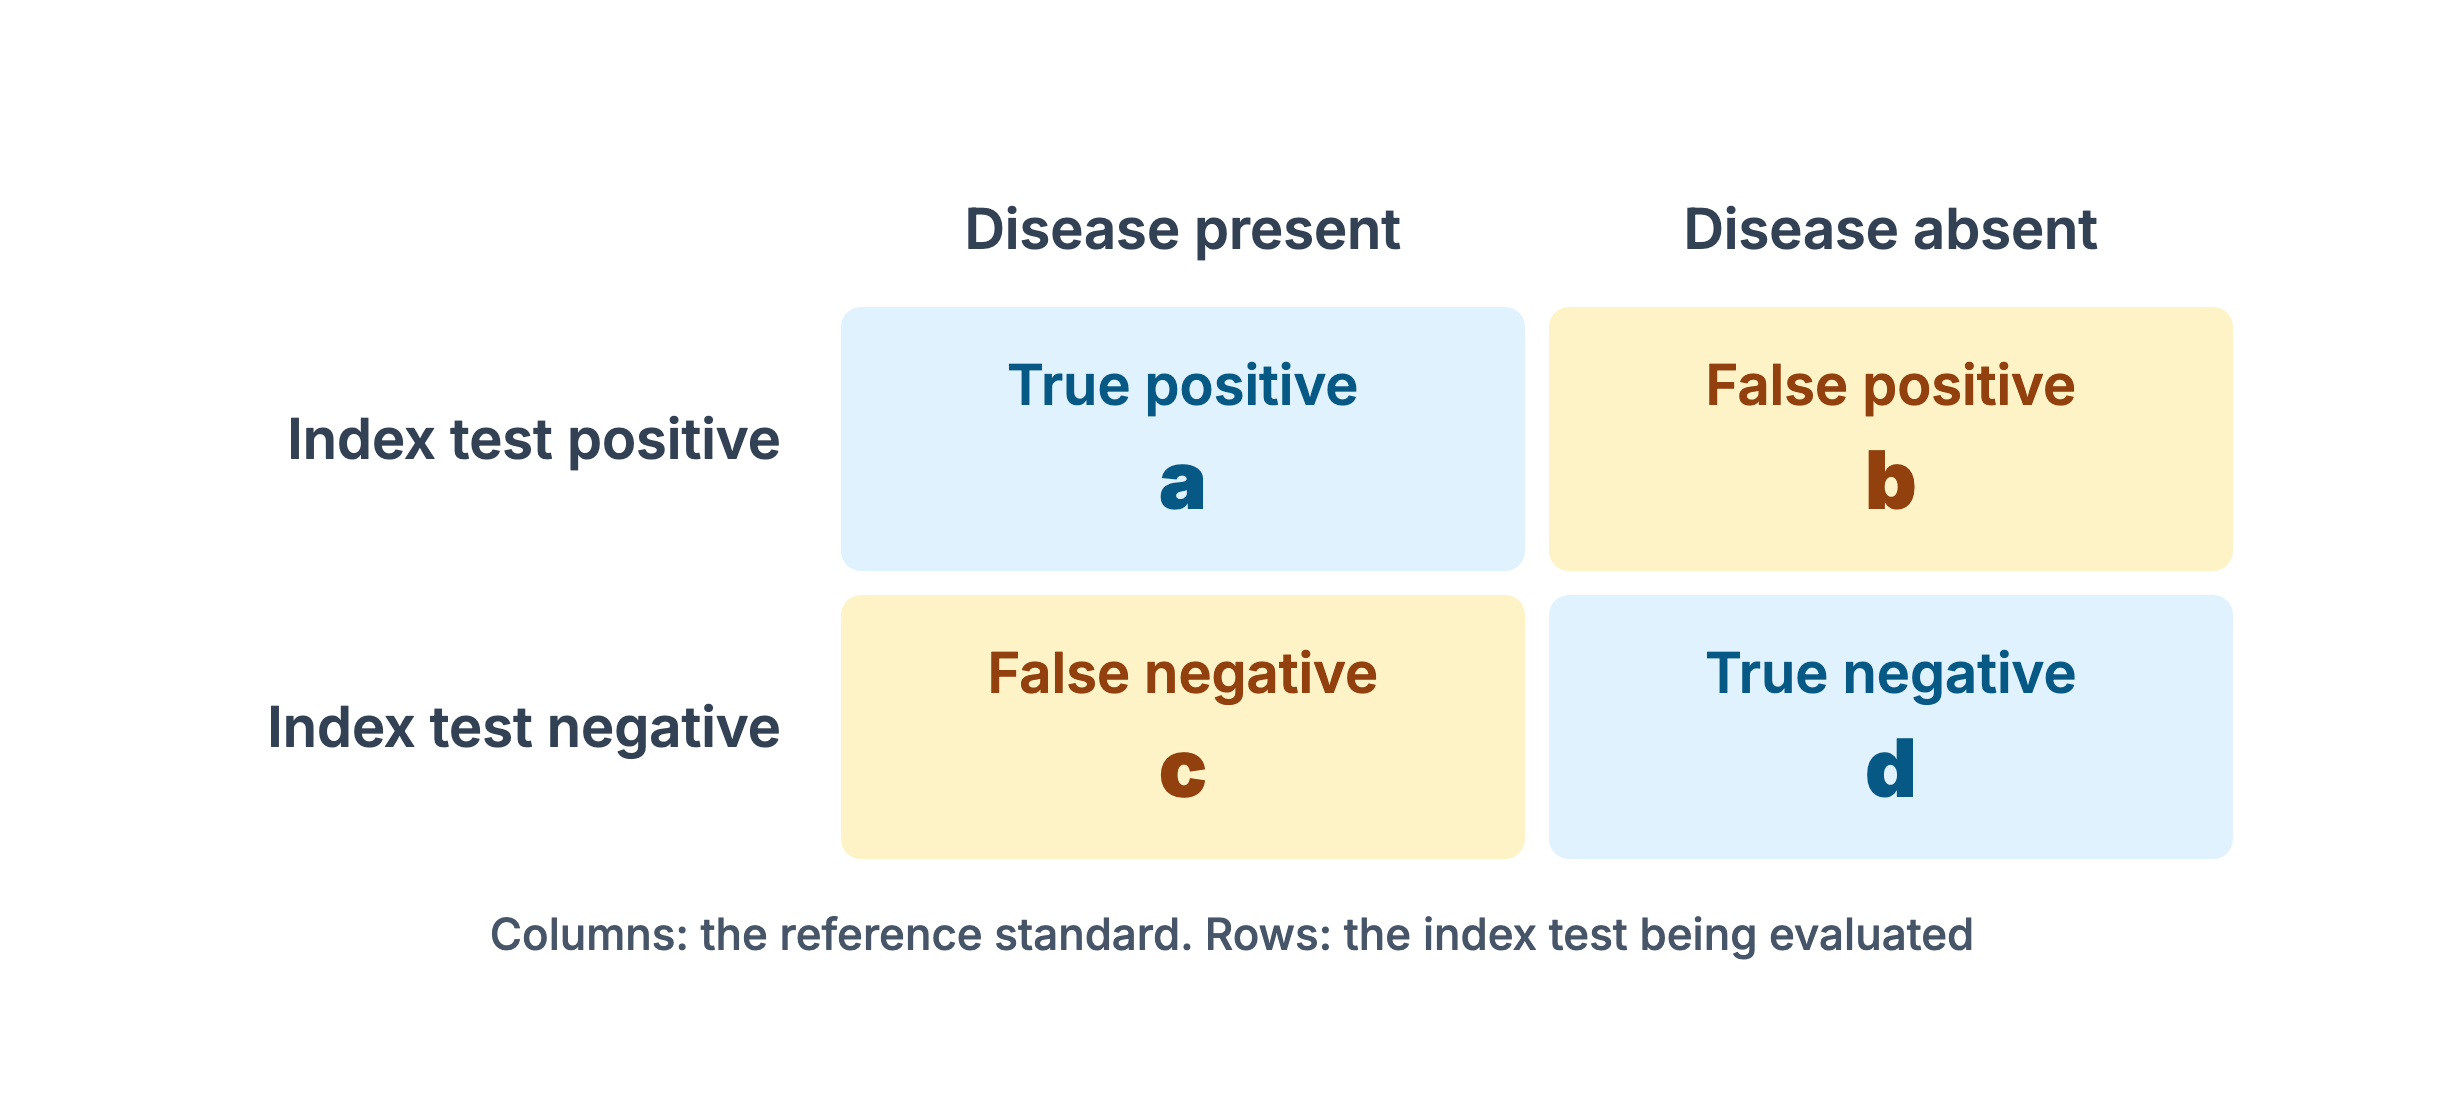
The index test is the one being evaluated. The reference standard is the best available measure of true disease status. Both are applied to the same patients.
Slide 6
Diagnostic accuracy
Sensitivity, specificity, and predictive values from the four cells
Sensitivity: a / (a + c)
Specificity: d / (b + d)
Positive predictive value: a / (a + b)
Negative predictive value: d / (c + d)
Slide 7
Diagnostic accuracy
Predictive values depend on prevalence
Sensitivity and specificity are properties of the test in a given population
The same test gives a different PPV in a referral clinic than in screening
At 98% specificity and 1% prevalence, most positives are still false alarms
Slide 8
Diagnostic accuracy
When the result is a number and not a verdict
Antibody titers, viral loads, CD4 counts, and quantitative biomarkers
A higher positivity threshold raises specificity and lowers sensitivity
An ROC curve plots sensitivity against 1 minus specificity across thresholds
Slide 9
Diagnostic accuracy
Where to set the threshold is a clinical decision
If missing a case is far worse, pick a low threshold to maximize sensitivity
If false positives trigger invasive workup or harmful treatment, pick a higher one
The ROC curve maps the trade-off; the choice depends on what comes after the test
Slide 10
From discovery to deployment
Analytical validation, clinical validation, and clinical utility
Analytical: does the assay reliably measure what it claims to measure?
Clinical: does a positive test correlate with disease in the intended-use population?
Utility: does using the test improve outcomes patients care about?
Slide 11
Designing the study
Accuracy estimates are only as good as the reference standard
For TB, culture is the conventional reference but misses paucibacillary disease
For depression, a structured clinical interview is itself imperfect
An index test that finds cases the reference misses will look falsely inaccurate
Slide 12
Designing the study
Single-gate and two-gate enrollment
Single-gate
Everyone with the clinical question
Both tests applied to all of them
Two-gate
Known cases, known non-cases, separately
Easier, but tends to overestimate accuracy
Slide 13
Designing the study
The spectrum of disease and of controls
Sensitivity is usually higher in advanced disease than in early or mild disease
Specificity is usually higher when controls are healthy
The right spectrum is the one the test will actually encounter
Slide 14
Designing the study
Blinding, verification of every participant, and independence of the two tests
Review bias: the reader of one test knows the other result
Verification bias: negative index tests are less likely to be confirmed
Incorporation bias: the index test feeds into the reference diagnosis
Slide 15
STARD
Sample size is set by the precision needed around sensitivity and specificity
Sensitivity is estimated only among patients with disease
A rare disease means screening many patients to find enough cases
The STARD checklist is the field standard for what to report
Slide 16
Lawn et al., 2015
Smear microscopy, culture, and Xpert MTB/RIF for tuberculosis
Traditional diagnosis
Smear: 50 to 65% sensitivity
Culture: 6 to 8 weeks for results
Xpert MTB/RIF
Results in 2 hours
90% sensitivity, 99% specificity
Slide 17
Lawn et al., 2015
Rifampicin resistance and a 2% false-positive rate
Pooled sensitivity for rifampicin resistance was 95%
Specificity was only 98%
When prevalence is low, many positives may need confirmatory testing
Slide 18
Diagnostic accuracy
Strengths and limitations of diagnostic accuracy studies
Laboratory accuracy doesn't automatically translate into population impact
A reference standard may not exist for some conditions
Performance varies across settings and operators
A positive result is only useful if it reaches a clinician and changes care
Diagnostic accuracy studies
Slide 1Diagnostic accuracy is the umbrella term for how often a test gets the answer right.
Diagnostic accuracy studies
Does this person have the disease or not?
A blood smear for malaria
A chest x-ray for pneumonia
A rapid antigen test for HIV
Slide 2Most clinical decisions start with a question. Does this person have the disease or not? A diagnostic test is any procedure that helps answer it, like a blood smear for malaria, a chest x-ray for pneumonia, or a rapid antigen test for HIV. Some are simple and cheap, and others require specialized equipment and trained operators, but all of them share the same job: take a measurement on a patient, then use it to decide whether the disease is present or absent.
Diagnostic accuracy studies
A test can miss real disease, or flag disease that isn't there
Missed disease
A person who has TB tests negative
They walk out untreated
Falsely flagged disease
A person without TB tests positive
Six months of treatment for nothing
Slide 3No test gets this right every time, and there are two ways to be wrong. The test can miss real disease: a person who has TB tests negative and walks out untreated. Or it can flag disease that isn't there: a person without TB tests positive, gets put on a six-month treatment regimen, and is exposed to side effects for nothing. These errors don't cancel out. They have different consequences, and different tests trade off differently between them.
Diagnostic accuracy
Sensitivity and specificity
Sensitivity
Share of sick people who test positive
90% catches 9 of every 10 sick people
Specificity
Share of healthy people who test negative
95% falsely alarms on 5 of every 100
Slide 4Two numbers dominate the conversation. Sensitivity is the proportion of people with the disease who test positive. A test with 90% sensitivity identifies 9 out of every 10 truly sick people. Specificity is the proportion of people without the disease who test negative. A test with 95% specificity correctly clears 95 out of every 100 healthy people, and falsely alarms on the other 5. Both matter. A test that calls everyone positive has 100% sensitivity and zero practical value, and the right trade-off depends on the disease, the population, and what happens after a positive result.
Diagnostic accuracy
Every accuracy measure comes from the same table
The index test is the one being evaluated. The reference standard is the best available measure of true disease status. Both are applied to the same patients.
Slide 5Every accuracy metric comes from the same table. We apply the index test, the one we're evaluating, and a reference standard, the best available measure of true disease status, to the same patients. Then we cross-tabulate, and we get true positives, false positives, false negatives, and true negatives.
Diagnostic accuracy
Sensitivity, specificity, and predictive values from the four cells
Sensitivity: a / (a + c)
Specificity: d / (b + d)
Positive predictive value: a / (a + b)
Negative predictive value: d / (c + d)
Slide 6Sensitivity is the true positives over everyone with disease. Specificity is the true negatives over everyone without it. The positive predictive value asks, of those who test positive, what proportion truly have it? And the negative predictive value asks the same of those who test negative. Likelihood ratios come from the same table, and they let us update a pre-test probability into a post-test probability.
Diagnostic accuracy
Predictive values depend on prevalence
Sensitivity and specificity are properties of the test in a given population
The same test gives a different PPV in a referral clinic than in screening
At 98% specificity and 1% prevalence, most positives are still false alarms
Slide 7Sensitivity and specificity are properties of the test in a given population, but predictive values depend on prevalence. The same test produces a different positive predictive value in a high-prevalence referral clinic than in a low-prevalence screening setting. Imagine a test that's 98% specific, used in a population where only 1% of those tested actually have the disease. Most positives will still be false alarms.
Diagnostic accuracy
When the result is a number and not a verdict
Antibody titers, viral loads, CD4 counts, and quantitative biomarkers
A higher positivity threshold raises specificity and lowers sensitivity
An ROC curve plots sensitivity against 1 minus specificity across thresholds
Slide 8Some tests return a binary result by design, like a lateral flow strip that shows a line or doesn't. But many tests produce a continuous value, like a viral load or a CD4 count, and then sensitivity and specificity depend on where we draw the line. Move the positivity threshold higher and we raise specificity but lose sensitivity, and moving it lower does the reverse. Plotting sensitivity against 1 minus specificity across thresholds gives a receiver operating characteristic curve. The area under that curve summarizes overall discrimination across all possible cutoffs. An area of 0.5 means the test is no better than a coin flip, 1.0 means perfect separation, and most useful tests live between 0.7 and 0.95.
Diagnostic accuracy
Where to set the threshold is a clinical decision
If missing a case is far worse, pick a low threshold to maximize sensitivity
If false positives trigger invasive workup or harmful treatment, pick a higher one
The ROC curve maps the trade-off; the choice depends on what comes after the test
Slide 9Where we actually set the threshold is a clinical decision, not a statistical one. If missing a case is far worse than calling a false positive, say when screening for an aggressive cancer with effective early treatment, we pick a low threshold to maximize sensitivity. If false positives trigger invasive workup or harmful treatment, we pick a higher threshold. The curve maps the trade-off, and the choice of point on it depends on what comes after the test.
From discovery to deployment
Analytical validation, clinical validation, and clinical utility
Analytical: does the assay reliably measure what it claims to measure?
Clinical: does a positive test correlate with disease in the intended-use population?
Utility: does using the test improve outcomes patients care about?
Slide 10A diagnostic test moves through several stages before it lands in a clinic. Analytical validation comes first. Does the assay reliably measure what it claims to measure? This work happens under controlled conditions, often with stored or contrived samples. Clinical validation is the harder step. Does a positive test correlate with disease in the people we'd actually use it on? We take the test into the intended-use population and compare its results against a reference standard, and this is where diagnostic accuracy is estimated. Clinical utility asks the question that often gets skipped: does using the test improve outcomes patients care about? Utility usually requires a different design, often a randomized trial comparing care with and without the test, because accuracy alone tells us nothing about downstream impact.
Designing the study
Accuracy estimates are only as good as the reference standard
For TB, culture is the conventional reference but misses paucibacillary disease
For depression, a structured clinical interview is itself imperfect
An index test that finds cases the reference misses will look falsely inaccurate
Slide 11Several design choices determine whether accuracy estimates can be trusted. The first is the reference standard, because the estimates can only be as good as the standard we're comparing against. For TB, mycobacterial culture is the conventional reference, but it misses paucibacillary disease. For depression, the standard is often a structured clinical interview, which is itself imperfect. When the reference is imperfect, an index test that detects cases the reference misses will look falsely inaccurate.
Designing the study
Single-gate and two-gate enrollment
Single-gate
Everyone with the clinical question
Both tests applied to all of them
Two-gate
Known cases, known non-cases, separately
Easier, but tends to overestimate accuracy
Slide 12A single-gate design enrolls everyone presenting with the relevant clinical question and applies both tests to all of them. A two-gate design enrolls known cases and known non-cases separately. Two-gate studies are easier to assemble, but they tend to overestimate accuracy, because florid cases on one side and healthy controls on the other don't reflect the diagnostic dilemma the test will face in practice. Single-gate is the stronger design when you can manage it.
Designing the study
The spectrum of disease and of controls
Sensitivity is usually higher in advanced disease than in early or mild disease
Specificity is usually higher when controls are healthy
The right spectrum is the one the test will actually encounter
Slide 13Sensitivity is usually higher in advanced disease than in early or mild disease, and specificity is usually higher when controls are healthy than when they have related conditions that might confuse the test. A study that enrolls only severe cases and healthy volunteers will overstate performance everywhere else. The right spectrum is the one the test will actually encounter.
Designing the study
Blinding, verification of every participant, and independence of the two tests
Review bias: the reader of one test knows the other result
Verification bias: negative index tests are less likely to be confirmed
Incorporation bias: the index test feeds into the reference diagnosis
Slide 14Three more choices each protect against a named bias. The person interpreting the index test shouldn't know the reference result, and vice versa. Without blinding, we get review bias. Every enrolled patient should receive the reference standard, not only those with a positive index test, or verification bias inflates apparent sensitivity. And if the index test contributes to the reference standard's adjudication, we get incorporation bias, and the index test looks more accurate than it really is.
STARD
Sample size is set by the precision needed around sensitivity and specificity
Sensitivity is estimated only among patients with disease
A rare disease means screening many patients to find enough cases
The STARD checklist is the field standard for what to report
Slide 15For sample size, the relevant calculation is the precision we need around sensitivity and specificity. Sensitivity is estimated only among patients with disease, so a rare disease forces us to screen many patients to find enough cases for a stable estimate. The STARD reporting checklist is the field standard for what to report, whether we're designing a study or appraising someone else's.
Lawn et al., 2015
Smear microscopy, culture, and Xpert MTB/RIF for tuberculosis
Traditional diagnosis
Smear: 50 to 65% sensitivity
Culture: 6 to 8 weeks for results
Xpert MTB/RIF
Results in 2 hours
90% sensitivity, 99% specificity
Slide 16Tuberculosis diagnosis traditionally relied on sputum smear microscopy, which is cheap and simple, but with only 50 to 65% sensitivity for culture-positive disease. Culture was more sensitive but took 6 to 8 weeks for results. The Xpert MTB/RIF assay detects TB and rifampicin resistance in 2 hours. Pooled sensitivity reached 90% for culture-positive cases, with 99% specificity, and sensitivity was comparable in HIV-positive and HIV-negative patients.
Lawn et al., 2015
Rifampicin resistance and a 2% false-positive rate
Pooled sensitivity for rifampicin resistance was 95%
Specificity was only 98%
When prevalence is low, many positives may need confirmatory testing
Slide 17For rifampicin resistance specifically, pooled sensitivity was 95%, but specificity was only 98%. That 2% false-positive rate matters enormously when prevalence is low, because many positive results may be false alarms that require confirmatory testing.
Diagnostic accuracy
Strengths and limitations of diagnostic accuracy studies
Laboratory accuracy doesn't automatically translate into population impact
A reference standard may not exist for some conditions
Performance varies across settings and operators
A positive result is only useful if it reaches a clinician and changes care
Slide 18Diagnostic accuracy studies can evaluate real-world performance and identify implementation barriers before wide deployment. But excellent laboratory sensitivity and specificity don't automatically translate into population impact. Supply chains, equipment maintenance, and care-seeking behavior all shape whether an accurate test actually saves lives. The design requires a reference standard, which may not exist for some conditions, and performance varies across settings and operators in ways laboratory validation can't predict. A positive result is only useful if it reaches a clinician, gets acted upon, and changes patient outcomes.