Chapter 11 · Video 3
Difference-in-differences and maternal health vouchers in Bangladesh
Print layout
Slide 1


Difference-in-differences
Slide 2
Difference-in-differences
Measuring change in both groups, before and after
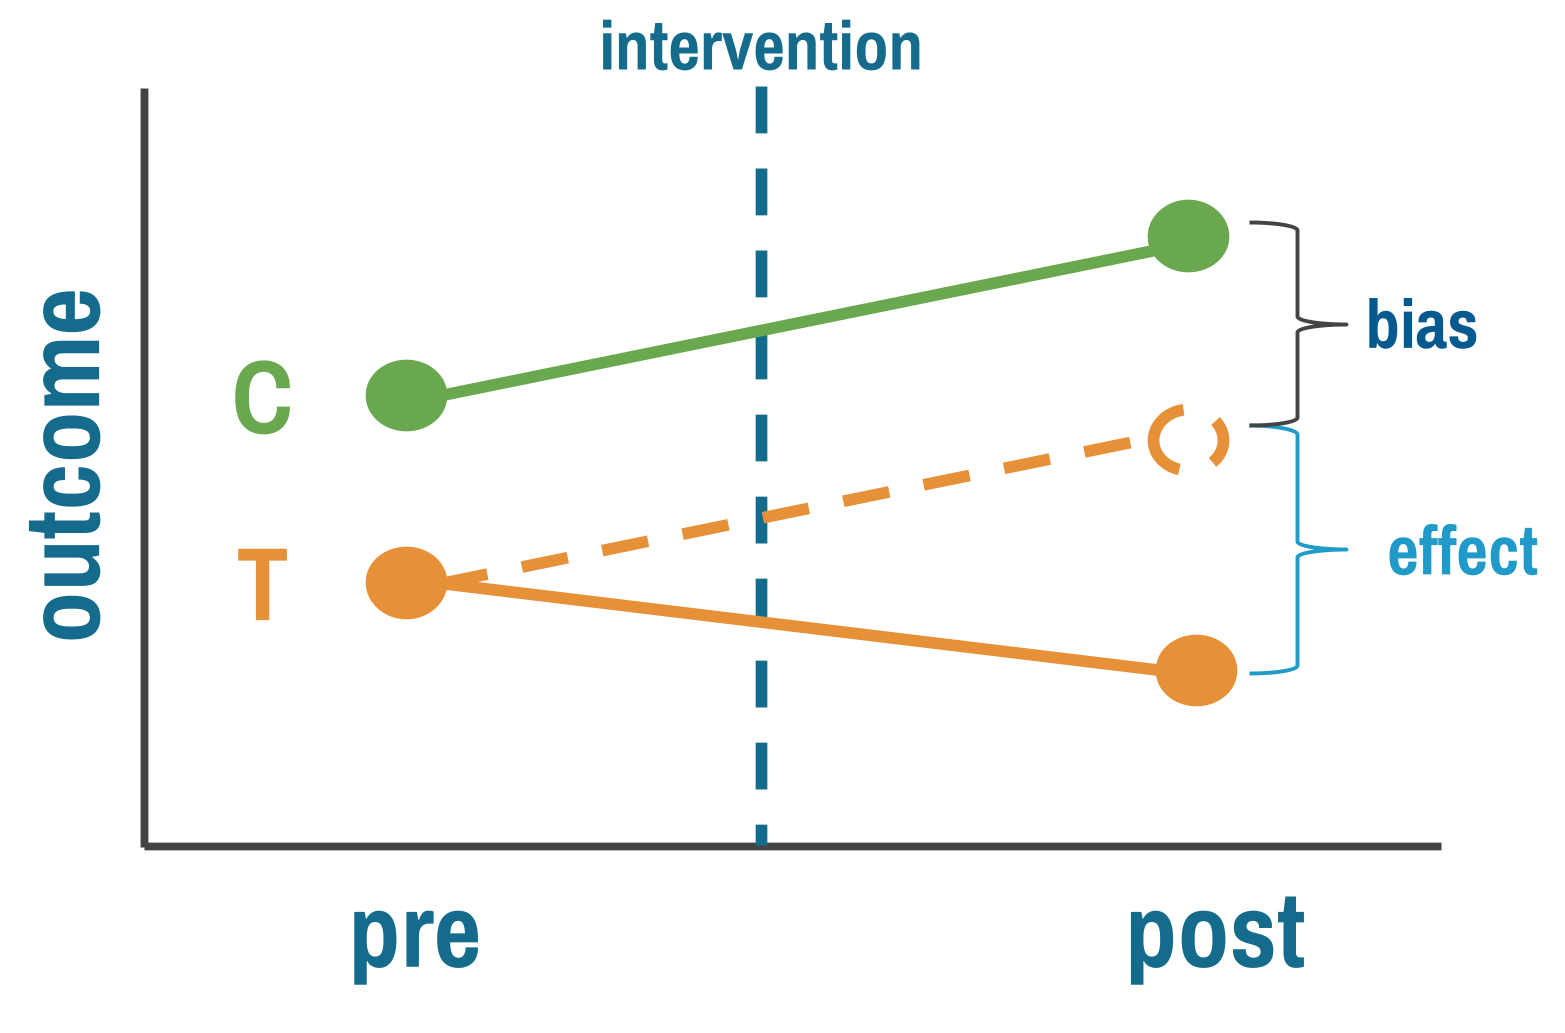
Difference-in-differences design. Reproduced from Chapter 11.
Slide 3
The comparison group's change stands in for the background trend
Unlike pre-post, it accounts for time trends
Unlike post-only comparisons, it accounts for baseline differences
Slide 4
Bangladesh, 2006
The Maternal Health Voucher Scheme (MHVS)
Vouchers for antenatal care, skilled delivery and postnatal services
Exchangeable at public or private providers
Rolled out across dozens of upazilas, or subdistricts
Slide 5
Upazilas were selected because they were poorer
Treated upazilas
Poorer and more rural
7.2% facility delivery before the scheme
Control upazilas
15.3% facility delivery before the scheme
Slide 6
Nandi et al., 2022
Five rounds of survey data and a staggered rollout
Demographic and Health Surveys, 2004 to 2017–18, covering births 2000 to 2016
55 treated upazilas, roughly 456 comparison upazilas
Event study models by two-year period before and after
Slide 7
Were treated and control upazilas on parallel trends?
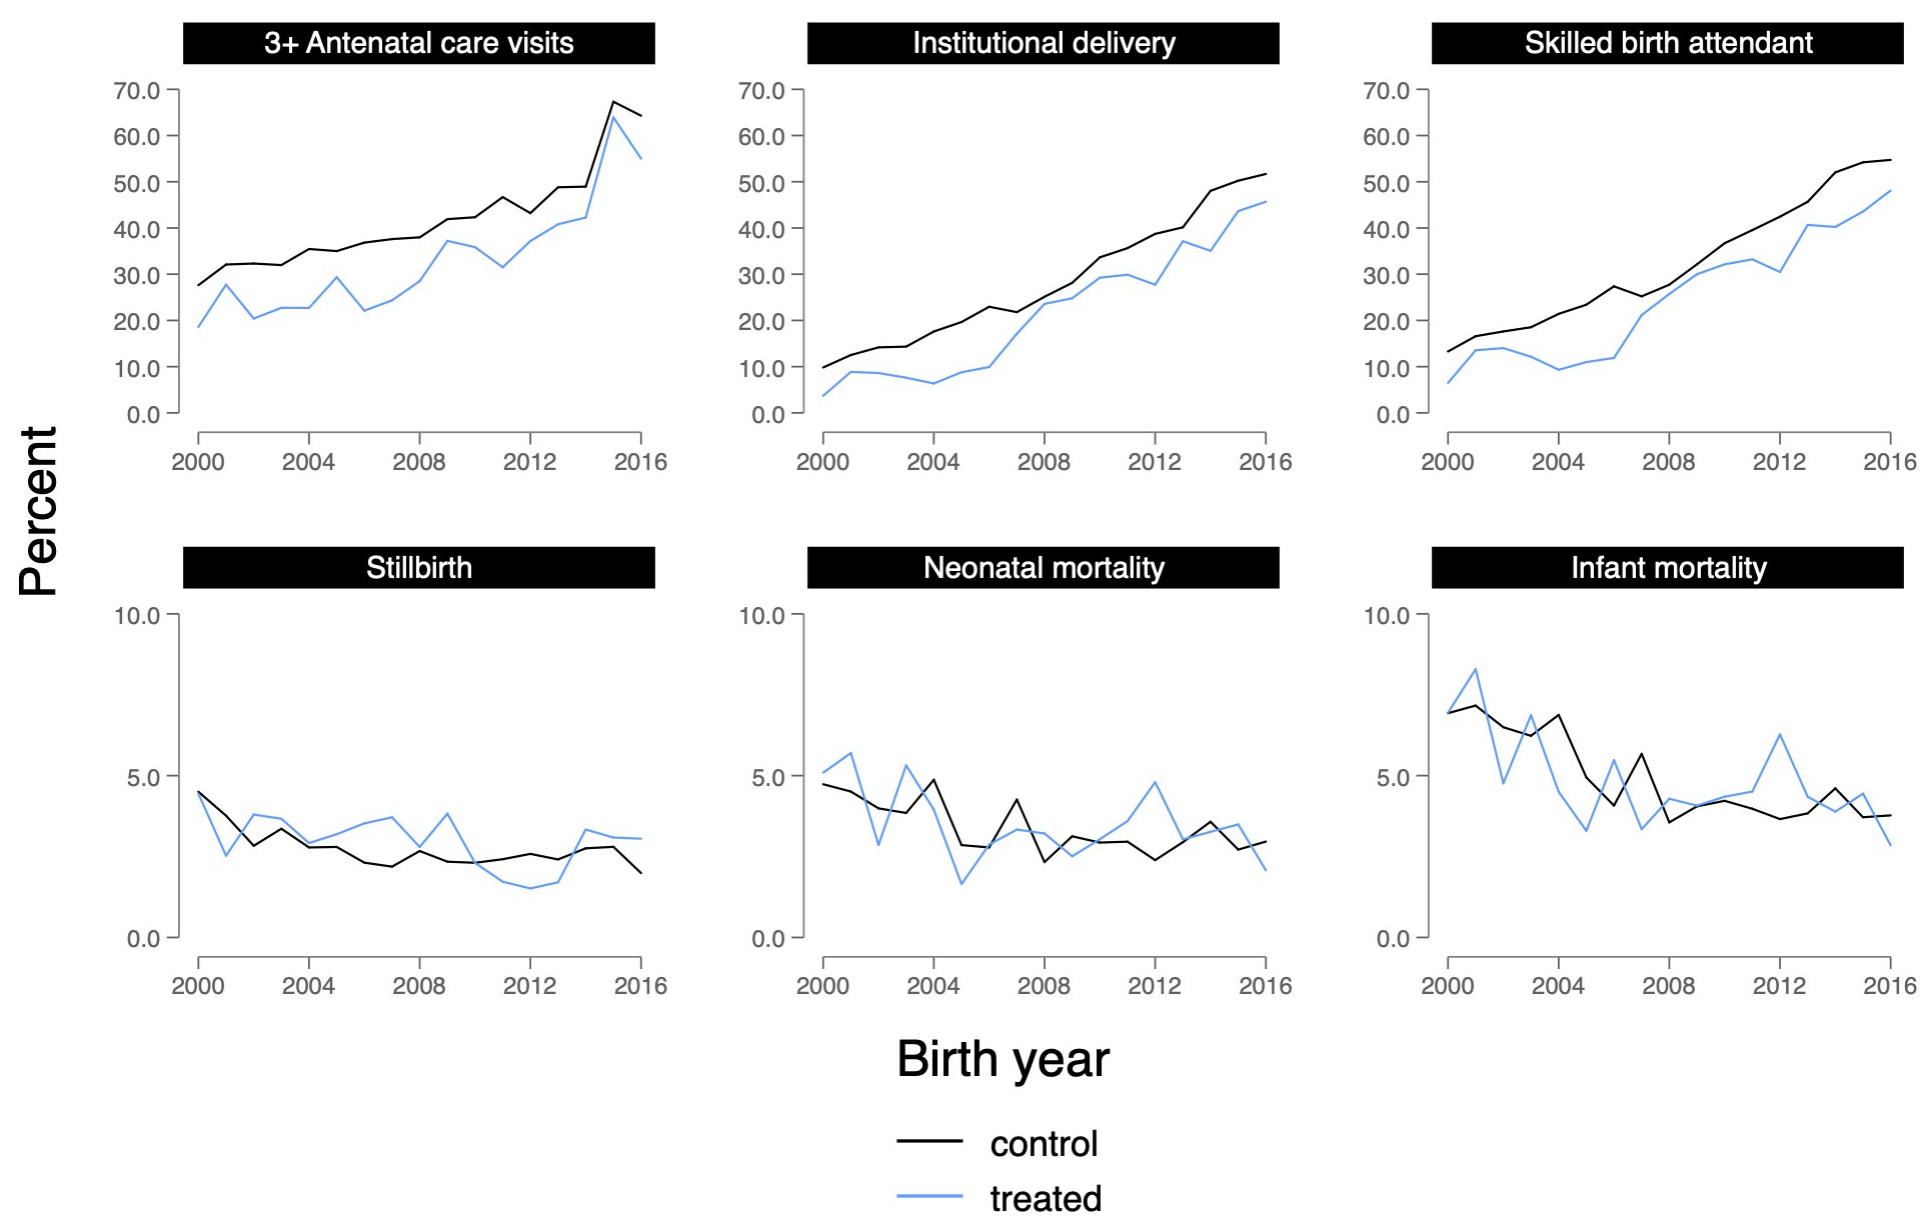
Maternal health service use, stillbirth, and neonatal and infant mortality in treated (blue) and control (black) upazilas, 2000–2016. Reproduced from Nandi et al. (2022) under CC-BY 4.0.
Slide 8
Event study estimates by two-year period
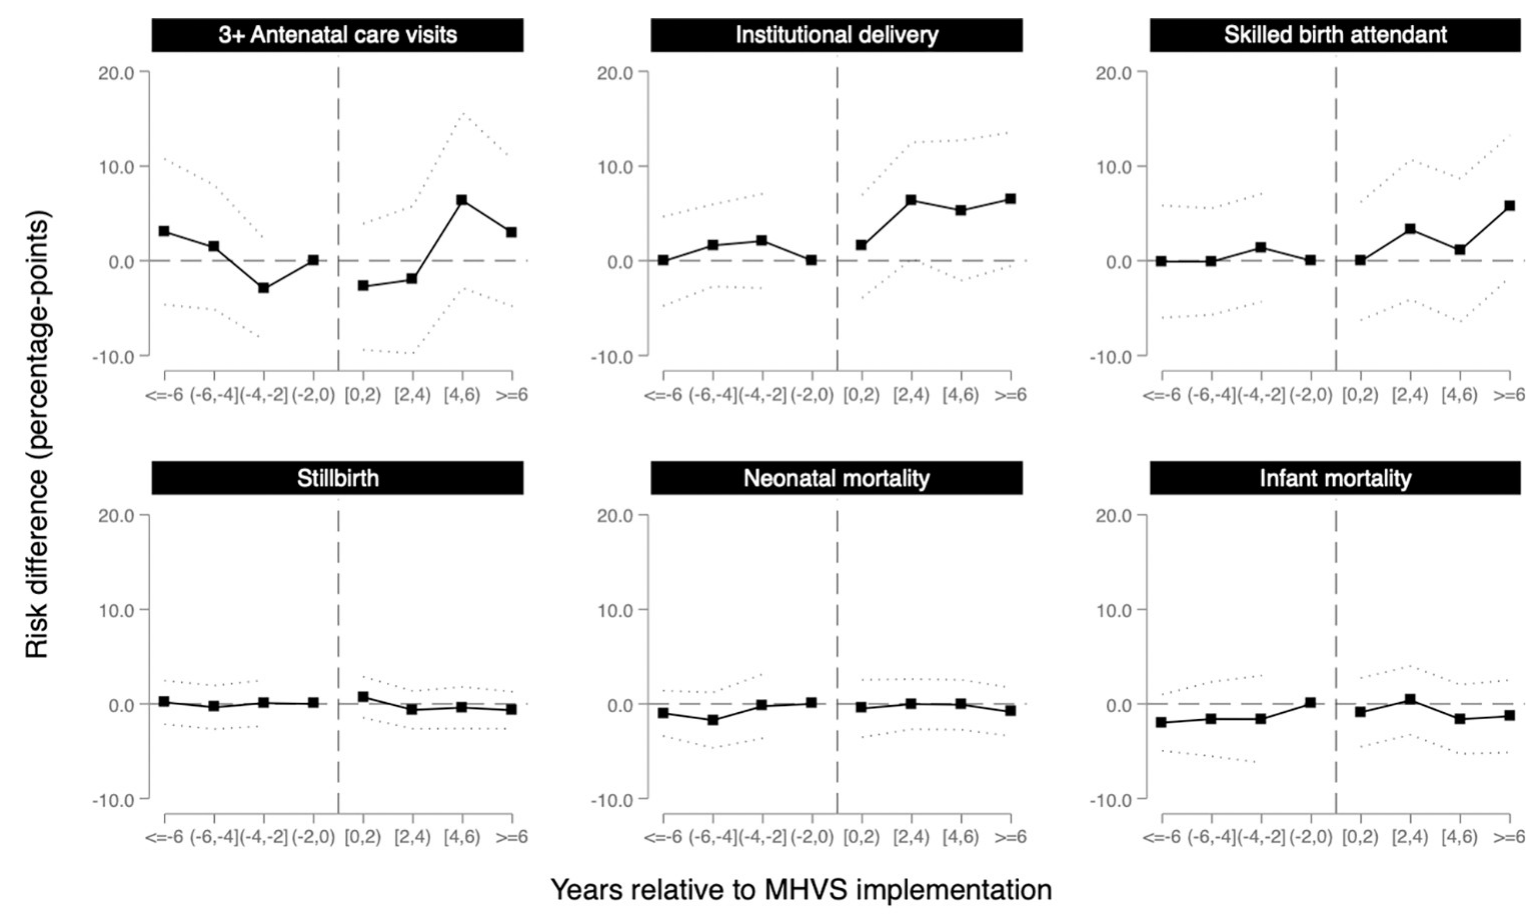
Effect of access to the MHVS by two-year period before and after implementation; the dashed line marks the start of the program. Reproduced from Nandi et al. (2022) under CC-BY 4.0.
Slide 9
Nandi et al., 2022
Facility delivery and skilled attendance after six years
Facility delivery
+6.5 percentage points
95% CI −0.6 to 13.6
Skilled birth attendant
+5.8 percentage points
95% CI −1.8 to 13.3
Slide 10
Nandi et al., 2022
Did the vouchers reduce stillbirth, neonatal or infant mortality?
No evidence of a reduction
Estimates were small, imprecise and near zero
Slide 11
Possible reasons the authors give
The program may not have reached the highest-risk women
Providers weren't adequately compensated
Facility birth is associated with lower breastfeeding initiation
Slide 12
In Closing
What difference-in-differences can and cannot tell us here
The program changed behavior
The design can't say why mortality didn't follow
Program failure, insufficient power, or concurrent changes
Difference-in-differences
Slide 1Difference-in-differences combines the best features of pre-post and between-group designs while mitigating some weaknesses of each. It has become a workhorse method in policy evaluation and program impact assessment.
Difference-in-differences
Measuring change in both groups, before and after
Difference-in-differences design. Reproduced from Chapter 11.
Slide 2We measure outcomes in both treatment and comparison groups, both before and after the intervention. We calculate how much the treatment group changed, and how much the comparison group changed over the same period. The difference between those two changes is our estimate of the treatment effect.
The comparison group's change stands in for the background trend
Unlike pre-post, it accounts for time trends
Unlike post-only comparisons, it accounts for baseline differences
Slide 3The comparison group is doing the heavy lifting. Its change over time estimates what would have happened to the treatment group without the intervention: the background trend from seasonal variation, economic shifts, or anything else that affected both groups equally. Subtracting it out leaves us with the treatment effect, in principle. Unlike pre-post, the design accounts for time trends, and unlike post-only comparisons, it accounts for baseline differences between groups.
Bangladesh, 2006
The Maternal Health Voucher Scheme (MHVS)
Vouchers for antenatal care, skilled delivery and postnatal services
Exchangeable at public or private providers
Rolled out across dozens of upazilas, or subdistricts
Slide 4Starting in 2006, the government of Bangladesh rolled out the Maternal Health Voucher Scheme across dozens of subdistricts, the basic unit of local governance. The program gave pregnant women vouchers they could exchange for antenatal care, skilled delivery, and postnatal services at public or private providers. The goal was to reduce financial barriers, increase facility-based deliveries, and ultimately reduce maternal and neonatal deaths.
Upazilas were selected because they were poorer
Treated upazilas
Poorer and more rural
7.2% facility delivery before the scheme
Control upazilas
15.3% facility delivery before the scheme
Slide 5The program wasn't randomized. Subdistricts were selected based on poverty, literacy, and the presence of health workers to administer the program, so by design, treated areas were poorer and more rural than untreated ones. Before the voucher scheme, only 7.2% of women in treated subdistricts delivered in a health facility, compared to 15.3% in control areas. That's the kind of baseline imbalance that makes a simple post-treatment comparison unreliable.
Nandi et al., 2022
Five rounds of survey data and a staggered rollout
Demographic and Health Surveys, 2004 to 2017–18, covering births 2000 to 2016
55 treated upazilas, roughly 456 comparison upazilas
Event study models by two-year period before and after
Slide 6The evaluation drew on five rounds of Bangladesh Demographic and Health Survey data, covering births from 2000 to 2016. The treatment group was the 55 subdistricts that received the voucher scheme, and the comparison group was roughly 456 subdistricts that didn't. Because the program rolled out in stages over about four years, the authors used event study models that estimated separate effects for each two-year period before and after implementation, so they could assess both parallel trends and the timing of any effects.
Were treated and control upazilas on parallel trends?
Maternal health service use, stillbirth, and neonatal and infant mortality in treated (blue) and control (black) upazilas, 2000–2016. Reproduced from Nandi et al. (2022) under CC-BY 4.0.
Slide 7The parallel trends evidence was strong for most outcomes. These are the raw trends in treated and control subdistricts from 2000 to 2016. For institutional delivery, the two lines track closely through the pre-intervention years, then begin to diverge after the voucher scheme starts, which is what a credible difference-in-differences analysis should look like.
Event study estimates by two-year period
Effect of access to the MHVS by two-year period before and after implementation; the dashed line marks the start of the program. Reproduced from Nandi et al. (2022) under CC-BY 4.0.
Slide 8The event study coefficients tell the same story more formally. Pre-intervention estimates hover near zero, confirming that treated and control subdistricts were on similar trajectories before the program. Effects then emerge gradually, with a lag of two to four years, consistent with a program that takes time to change behavior.
Nandi et al., 2022
Facility delivery and skilled attendance after six years
Facility delivery
+6.5 percentage points
95% CI −0.6 to 13.6
Skilled birth attendant
+5.8 percentage points
95% CI −1.8 to 13.3
Slide 9After six years of access to the voucher scheme, the probability of delivering in a health facility increased by 6.5 percentage points, with a 95% confidence interval from negative 0.6 to 13.6. Having a skilled birth attendant increased by 5.8 percentage points, with an interval from negative 1.8 to 13.3. These are meaningful increases in a context where baseline facility delivery was below 10%.
Nandi et al., 2022
Did the vouchers reduce stillbirth, neonatal or infant mortality?
No evidence of a reduction
Estimates were small, imprecise and near zero
Slide 10Despite these gains in service utilization, the study found no evidence that the voucher program reduced stillbirth, neonatal mortality, or infant mortality. The estimates were small and imprecise, hovering near zero. More women were delivering in facilities, but babies weren't surviving at higher rates.
Possible reasons the authors give
The program may not have reached the highest-risk women
Providers weren't adequately compensated
Facility birth is associated with lower breastfeeding initiation
Slide 11The authors point to several possibilities. The program may not have reached the highest-risk women: eligibility criteria weren't always enforced, and awareness was uneven. Providers weren't adequately compensated, potentially reducing quality of care as patient volume increased. And facility birth in Bangladesh is associated with lower breastfeeding initiation, which could offset some of the survival benefits of skilled attendance.
In Closing
What difference-in-differences can and cannot tell us here
The program changed behavior
The design can't say why mortality didn't follow
Program failure, insufficient power, or concurrent changes
Slide 12The design can tell us that the program changed behavior, but it can't tell us why that change didn't translate into the outcome that mattered most. It also can't resolve whether the null mortality finding reflects true program failure, insufficient statistical power, or confounding from concurrent changes in treated areas. The authors are transparent about each of these possibilities, which is what good quasi-experimental research looks like.