Chapter 3 · Video 4
Explain and predict: why, what if, what comes next
Print layout
Slide 1


Explain and predict: why, what if, what comes next
Slide 2
Description tells you the characteristics of a problem
More than half of married women of reproductive age in Nepal
Were not using a modern method of contraception in 2010
Useful if you are concerned with promoting reproductive health
Slide 3
But description only gets you so far
Why is uptake lower among younger women?
What happens if we introduce a policy or program to promote use?
Can we explain patterns of modern method use?
Slide 4
Bhatt et al., 2021
One way to explore a why question is to ask people
Six group discussions and 25 interviews in one village in Nepal
Teachers, youths, health workers, religious leaders, government officials
The topic: low use of modern methods among young people
Slide 5
Bhatt et al., 2021 · Female, 24 years old
"I did not have enough information about contraceptive measures"
"My husband works abroad. Last year, when he came home during Dashain, we had (intercourse)"
"Meanwhile, I came to know that I was pregnant, after 3 months. I was shocked to hear that"
"We already had 3 children; 2 of them were unplanned"
"Had I known about them; I would have used them"
Slide 6
Young people face numerous barriers to initiating family planning
The team analyzed transcripts with passages like this one
Including a lack of awareness, as this woman describes
And closed with several ideas for designing new interventions
Slide 7
Shmueli, 2010 · Gelman et al., 2020
The other route to why and what if is causal inference
Explanatory modeling: statistical models for testing causal explanations
What would happen to outcome y under treatment z, given pre-treatment information x
Slide 8
Shmueli, 2010
Where the data come from
Sometimes
An experiment
Random assignment to conditions
Active introduction of treatment
Most often
Non-experimental data
Associations between variables
As in much social science
Slide 9
Global Health in Practice
Postpartum family planning
Women want to prevent or space the next pregnancy after giving birth
But 60% do not start a method before their fertility returns
In most cases ovulation returns before family planning is started
One option: an IUD inserted immediately after delivery of the placenta
Slide 10
Modern method use rose in both the early and late postpartum groups
Modern contraceptive use by time since delivery. Image source: Wu et al., 2020, CC BY-NC 4.0.
Slide 11
Pradhan et al., 2019
A stepped-wedge design turns the intervention on in stages
The outcome: new mothers who opt to have an IUD inserted after childbirth
Counseling was turned on in six hospitals in a stepwise fashion
Three hospitals randomly assigned to Group 1 received it first
Roughly six months later, the rest began, one after the other
Slide 12
Uptake jumped in each group after the intervention arrived
Trends in PPIUD uptake; vertical lines mark approximate intervention start-dates. Image source: Pradhan et al., 2019, CC BY 4.0.
Slide 13
Shmueli, 2010
The third learning goal is prediction
Using data and algorithms to predict new or future observations
You might know this as artificial intelligence or machine learning
I'll stick with the more general term: prediction modeling
Slide 14
Prediction modeling has gone full rocket-launch in medicine
Data scientists once worked for incremental gains in movie recommendations
Now they teach computers to outperform radiologists in detecting pathology
Increasingly the same tools are applied to public health challenges
Slide 15
More than 1 in 3 women stop using contraception within 12 months
The pattern holds across low- and middle-income countries
Discontinuation puts them at risk of unintended and mistimed pregnancies
What if we could predict who, and offer support at the start?
Slide 16
Rothschild et al., 2020
A discontinuation risk score, built and then validated
More than 700 Kenyan women who did not want to get pregnant, over 24 weeks
75% of the data built the score: method choice, education, marital status
The remaining 25% was reserved to validate the new tool
Discontinuation was almost 2 to 6 times higher among women labeled high risk
Slide 17
In Closing
A caution about the word predictor
In regression results, predictors are independent variables
You can use regression to predict future or unseen values
But as often applied, it is mostly fancy averaging at one time point
Next: turning a learning goal into a question you can answer
Explain and predict: why, what if, what comes next
Slide 1The last video was about describing what exists. This video is about two more learning goals: explaining why something happens, and predicting what happens next.
Description tells you the characteristics of a problem
More than half of married women of reproductive age in Nepal
Were not using a modern method of contraception in 2010
Useful if you are concerned with promoting reproductive health
Slide 2Description is essential to science and to decision-making related to needs and resources. The result suggests that more than half of married women of reproductive age were not using a modern method of contraception in 2010. This is useful to know if you work for the Ministry of Health and are concerned about promoting reproductive health.
But description only gets you so far
Why is uptake lower among younger women?
What happens if we introduce a policy or program to promote use?
Can we explain patterns of modern method use?
Slide 3But description only gets you so far. You might want to go the next step and ask, why is uptake lower among younger women? And, what happens if we introduce a policy or program intended to promote contraceptive use? Can we explain patterns of modern method use?
Bhatt et al., 2021
One way to explore a why question is to ask people
Six group discussions and 25 interviews in one village in Nepal
Teachers, youths, health workers, religious leaders, government officials
The topic: low use of modern methods among young people
Slide 4One way to explore a why question is to ask people. That's what one research team did in Nepal, to understand the reasons for low use of modern methods of contraception among young people. They organized six group discussions and conducted 25 interviews with a diverse mix of informants from one village, including teachers, youths, health workers, religious leaders, and government officials.
Bhatt et al., 2021 · Female, 24 years old
"I did not have enough information about contraceptive measures"
"My husband works abroad. Last year, when he came home during Dashain, we had (intercourse)"
"Meanwhile, I came to know that I was pregnant, after 3 months. I was shocked to hear that"
"We already had 3 children; 2 of them were unplanned"
"Had I known about them; I would have used them"
Slide 5One woman explained her non-use this way. Her husband works abroad. He came home during a festival, and three months later she learned she was pregnant. She was shocked. They already had three children, two of them unplanned. She did not have enough information about contraceptive measures in that situation. Had she known about them, she says, she would have used them. Her words are on the screen.
Young people face numerous barriers to initiating family planning
The team analyzed transcripts with passages like this one
Including a lack of awareness, as this woman describes
And closed with several ideas for designing new interventions
Slide 6The authors analyzed transcripts with passages like this and reported that young people face numerous barriers to initiating family planning, including a lack of awareness as described by this woman. They concluded the article with several ideas for designing new interventions, new programs, to promote modern method use among this group.
Shmueli, 2010 · Gelman et al., 2020
The other route to why and what if is causal inference
Explanatory modeling: statistical models for testing causal explanations
What would happen to outcome y under treatment z, given pre-treatment information x
Slide 7Another common method for exploring why and what if questions is explanatory modeling, the use of statistical models for testing causal explanations. This work also falls under the label of causal inference, which one team defines as follows: what would happen to an outcome y as a result of a treatment, intervention, or exposure z, given pre-treatment information x.
Shmueli, 2010
Where the data come from
Sometimes
An experiment
Random assignment to conditions
Active introduction of treatment
Most often
Non-experimental data
Associations between variables
As in much social science
Slide 8Sometimes researchers ask these questions in the context of an experiment that features random assignment to conditions and active introduction of the treatment, intervention, or exposure. But most often, research in the social sciences examines associations between variables in non-experimental data.
Global Health in Practice
Postpartum family planning
Women want to prevent or space the next pregnancy after giving birth
But 60% do not start a method before their fertility returns
In most cases ovulation returns before family planning is started
One option: an IUD inserted immediately after delivery of the placenta
Slide 9Before the examples, some context. Research in low-income countries has found that women want to prevent or space their next pregnancy after they have given birth, but 60 percent do not start a method of family planning before their fertility returns. Precisely when women become fertile after childbirth varies, and is influenced by factors like breastfeeding, but in most cases ovulation returns before family planning is started. This puts women at risk of an unwanted or mistimed pregnancy. One option to reduce this risk is to have an intrauterine device, or IUD, inserted immediately after delivery of the placenta or within the first month postpartum.
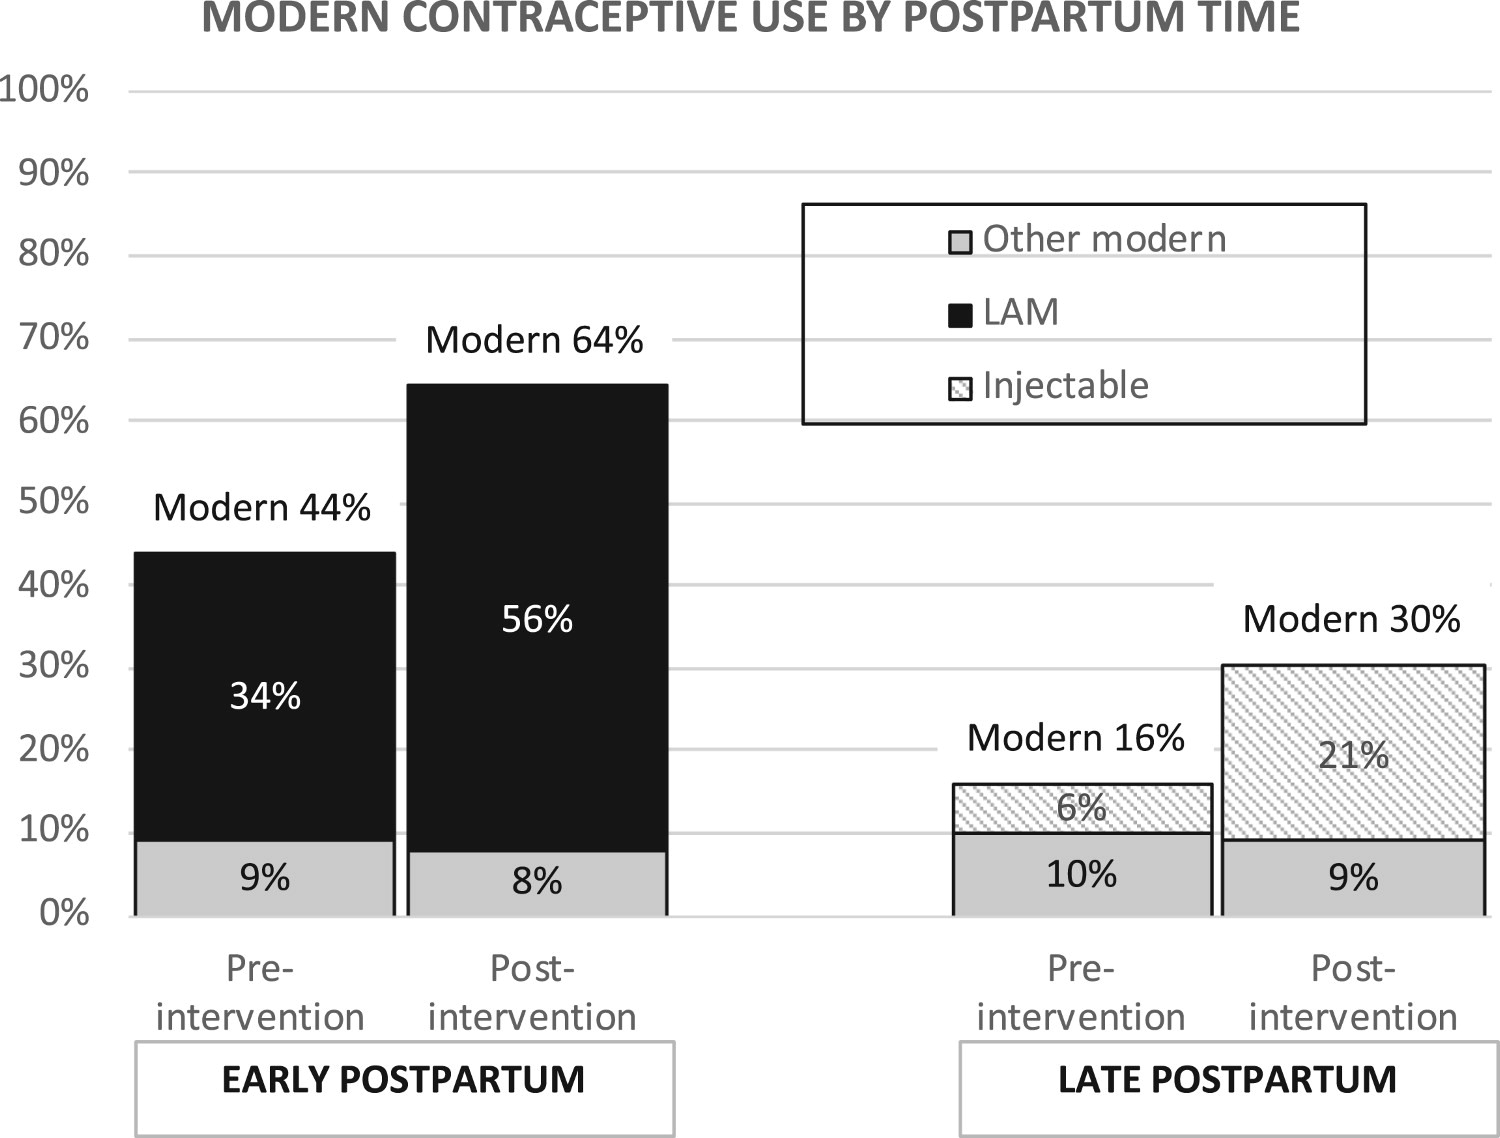
Modern method use rose in both the early and late postpartum groups
Modern contraceptive use by time since delivery. Image source: Wu et al., 2020, CC BY-NC 4.0.
Slide 10Let's consider two examples of causal inference, both on modern method use. In the first, researchers looked at the prevalence of modern contraceptive use in a rural municipality in one of Nepal's poorest districts, before and after a pilot program was implemented. In this program, community health workers conducted home visits with pregnant women and new mothers and offered them contraceptive counseling. The authors reported that overall modern method use increased from 29 percent pre-intervention to 46 percent post-intervention. The figure breaks that out by time since delivery: from 44 to 64 percent among women in the early postpartum period, and from 16 to 30 percent among women in the late postpartum period. But as we'll discuss in a later chapter, this non-experimental design requires strong assumptions for attributing the observed change to this program.
Pradhan et al., 2019
A stepped-wedge design turns the intervention on in stages
The outcome: new mothers who opt to have an IUD inserted after childbirth
Counseling was turned on in six hospitals in a stepwise fashion
Three hospitals randomly assigned to Group 1 received it first
Roughly six months later, the rest began, one after the other
Slide 11In our second example, a team used a stepped-wedge design to estimate the causal effect of offering postpartum family planning counseling on the proportion of new moms who opt to have an IUD inserted following childbirth. In this design, which you'll meet more formally in a later chapter, the counseling intervention was turned on in six hospitals in a stepwise fashion. The three hospitals randomly assigned to Group 1 received the intervention first, in a staggered start. Approximately six months later, the remaining hospitals began offering the counseling intervention, one after the other.
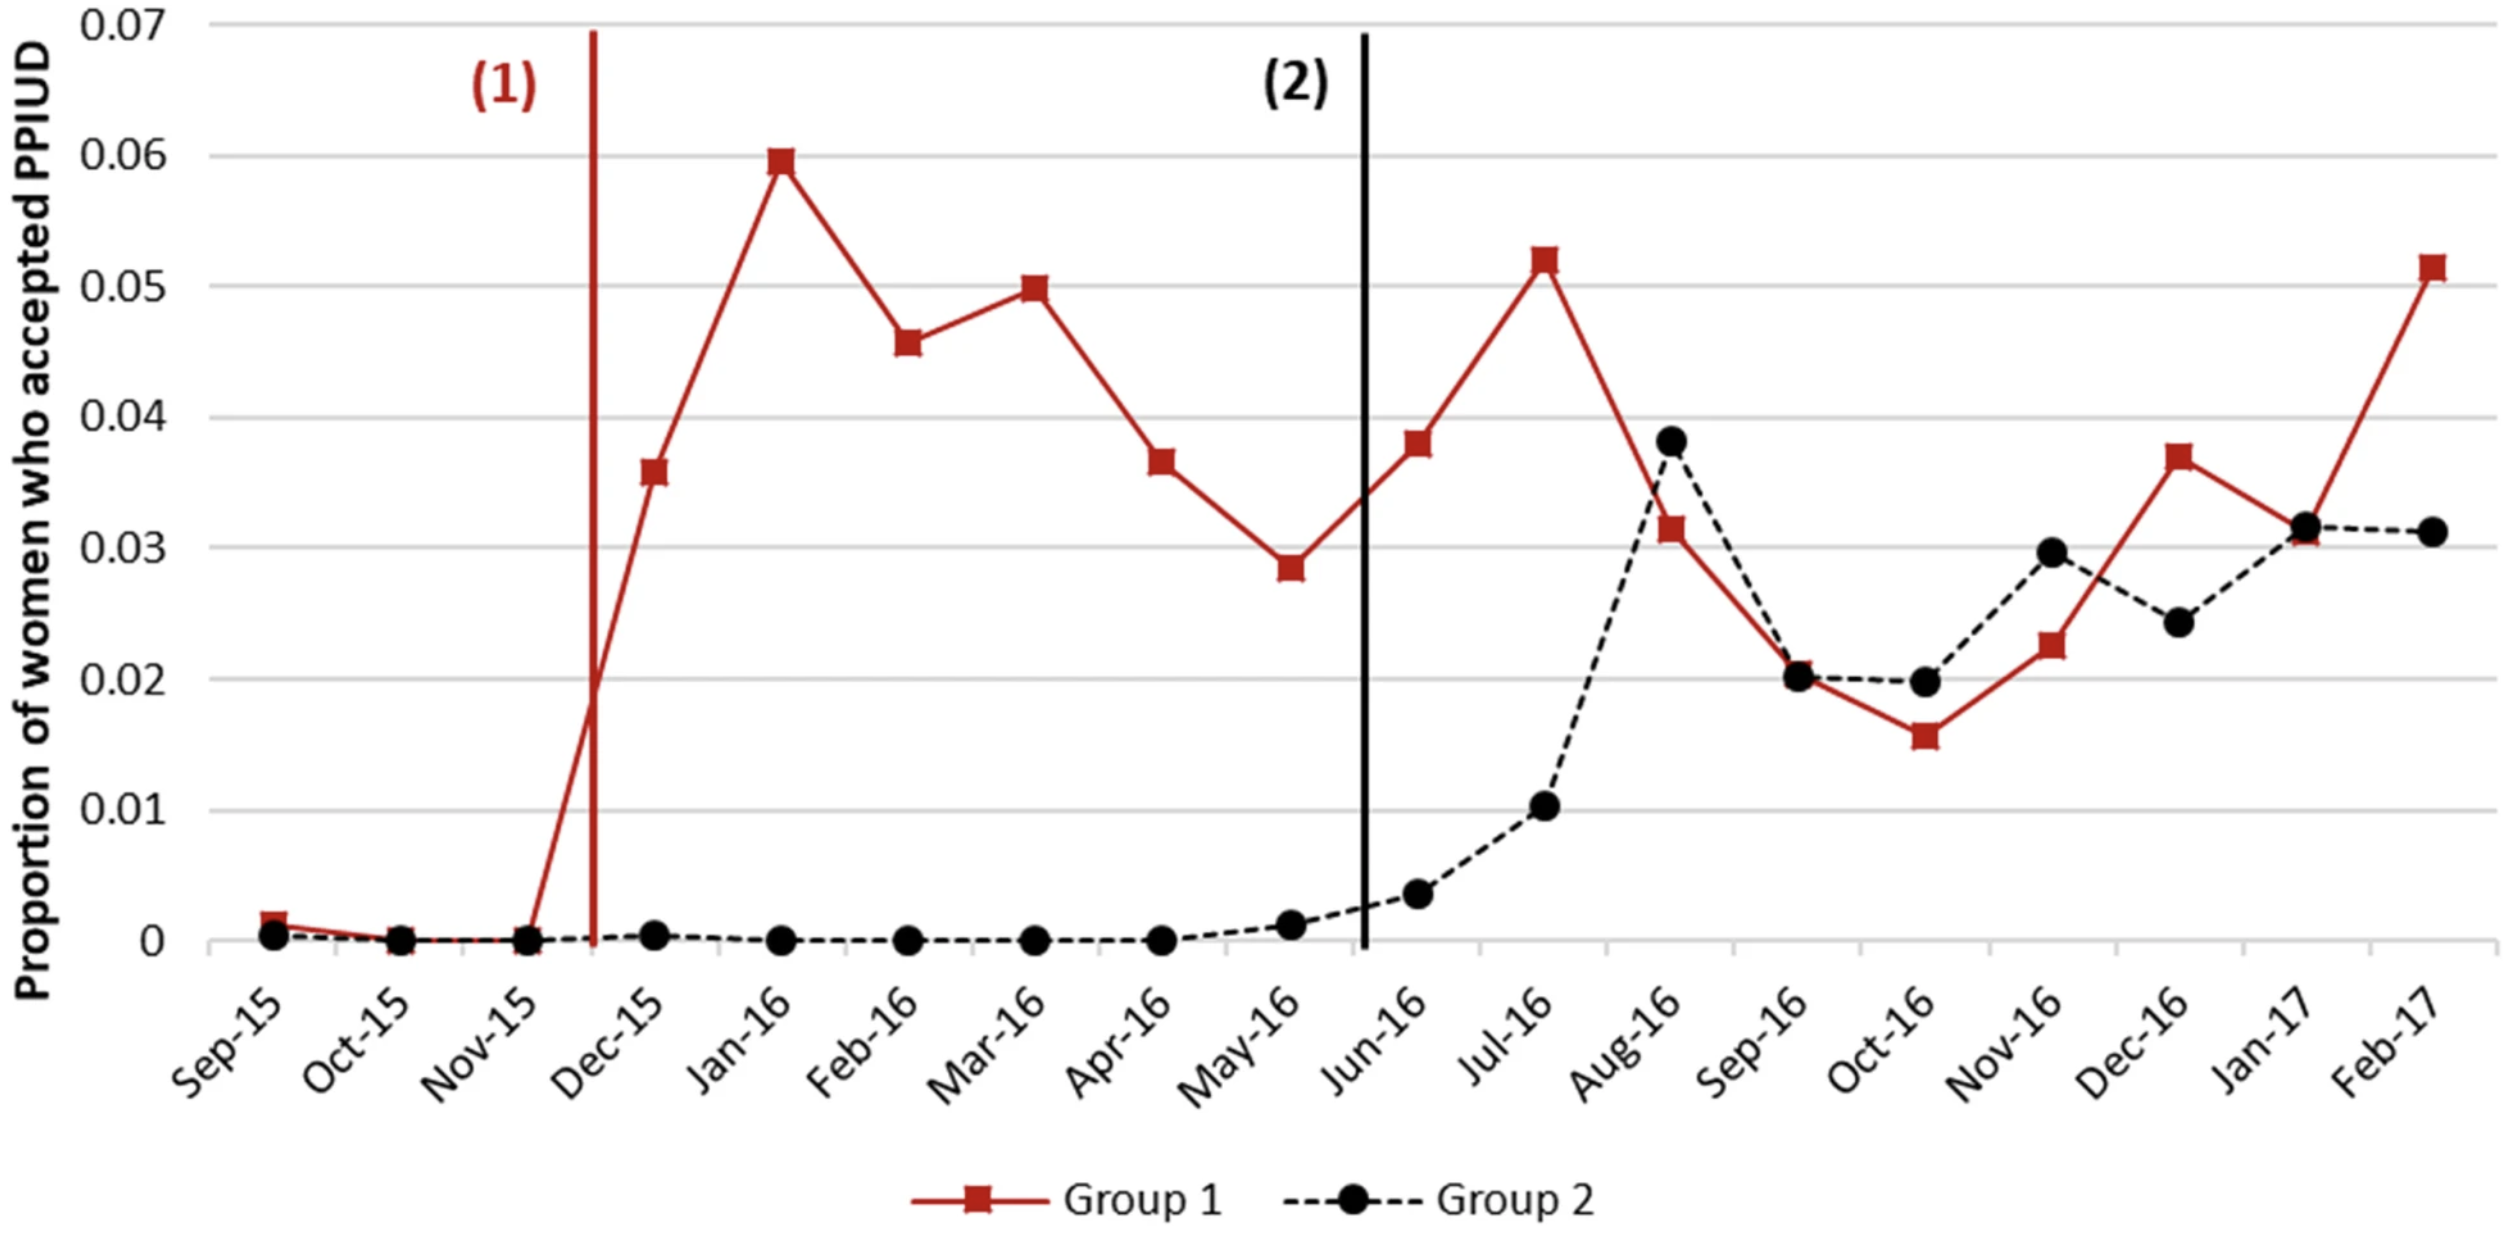
Uptake jumped in each group after the intervention arrived
Trends in PPIUD uptake; vertical lines mark approximate intervention start-dates. Image source: Pradhan et al., 2019, CC BY 4.0.
Slide 12The figure shows that rates of uptake appeared to jump in each group after the intervention was introduced. The authors estimated that the intervention increased IUD uptake by 4.4 percentage points, with a 95 percent confidence interval from 2.8 to 6.4 percentage points.
Shmueli, 2010
The third learning goal is prediction
Using data and algorithms to predict new or future observations
You might know this as artificial intelligence or machine learning
I'll stick with the more general term: prediction modeling
Slide 13The third common learning goal is to use data and algorithms to predict new or future observations. You might know this as the domain of artificial intelligence, machine learning, or deep learning. I'll stick with the more general term of prediction modeling.
Prediction modeling has gone full rocket-launch in medicine
Data scientists once worked for incremental gains in movie recommendations
Now they teach computers to outperform radiologists in detecting pathology
Increasingly the same tools are applied to public health challenges
Slide 14Prediction modeling has gone full rocket-launch in medicine. Data scientists who might have once worked hard for incremental gains in the quality of Netflix's movie recommendations are now searching for ways to teach computers to outperform radiologists in detecting pathology. Increasingly, the same tools are being applied to solving public health challenges.
More than 1 in 3 women stop using contraception within 12 months
The pattern holds across low- and middle-income countries
Discontinuation puts them at risk of unintended and mistimed pregnancies
What if we could predict who, and offer support at the start?
Slide 15Returning to the topic of contraception, prediction models help us to address a key public health challenge. More than 1 in 3 women in low- and middle-income countries stop using contraception within 12 months of starting, putting them at risk for unintended and mistimed pregnancies. What if there was a way to accurately predict who would eventually discontinue, and offer them additional support when starting a new method?
Rothschild et al., 2020
A discontinuation risk score, built and then validated
More than 700 Kenyan women who did not want to get pregnant, over 24 weeks
75% of the data built the score: method choice, education, marital status
The remaining 25% was reserved to validate the new tool
Discontinuation was almost 2 to 6 times higher among women labeled high risk
Slide 16One team took on this question, recruiting a cohort of more than 700 Kenyan women who did not want to get pregnant and following up with them over the course of 24 weeks to see who remained on a method and who stopped. The authors used data from 75 percent of the women to develop a discontinuation risk score, based on things like method choice, education, and marital status, and reserved the remaining 25 percent to validate their new tool. They found that discontinuation was almost 2 to 6 times higher among women labeled as high risk versus low risk. If you have a quantitative itch to scratch, now is the time to jump in.
In Closing
A caution about the word predictor
In regression results, predictors are independent variables
You can use regression to predict future or unseen values
But as often applied, it is mostly fancy averaging at one time point
Next: turning a learning goal into a question you can answer
Slide 17One caution before we move on. In papers that report regression results, you will often find references to predictor variables. These are the independent variables that predict the outcome. You can use regression to predict future, or unseen, values. But regression as often applied in the social sciences is mostly just fancy averaging with cross-sectional data obtained at one time point. So: describe, explain, predict. In the next video, we turn a learning goal into a question you can actually answer.