Chapter 9 · Video 2
From conceptual model to measurement
Print layout
Slide 1


From conceptual model to measurement
Slide 2
DAG example
A DAG doubles as a measurement planning tool
Every node tells you something about what data you need to collect
The minimum adjustment set is the smallest group of variables
It blocks all confounding paths between the exposure and the outcome
Slide 3
HPV vaccination and sexual behavior
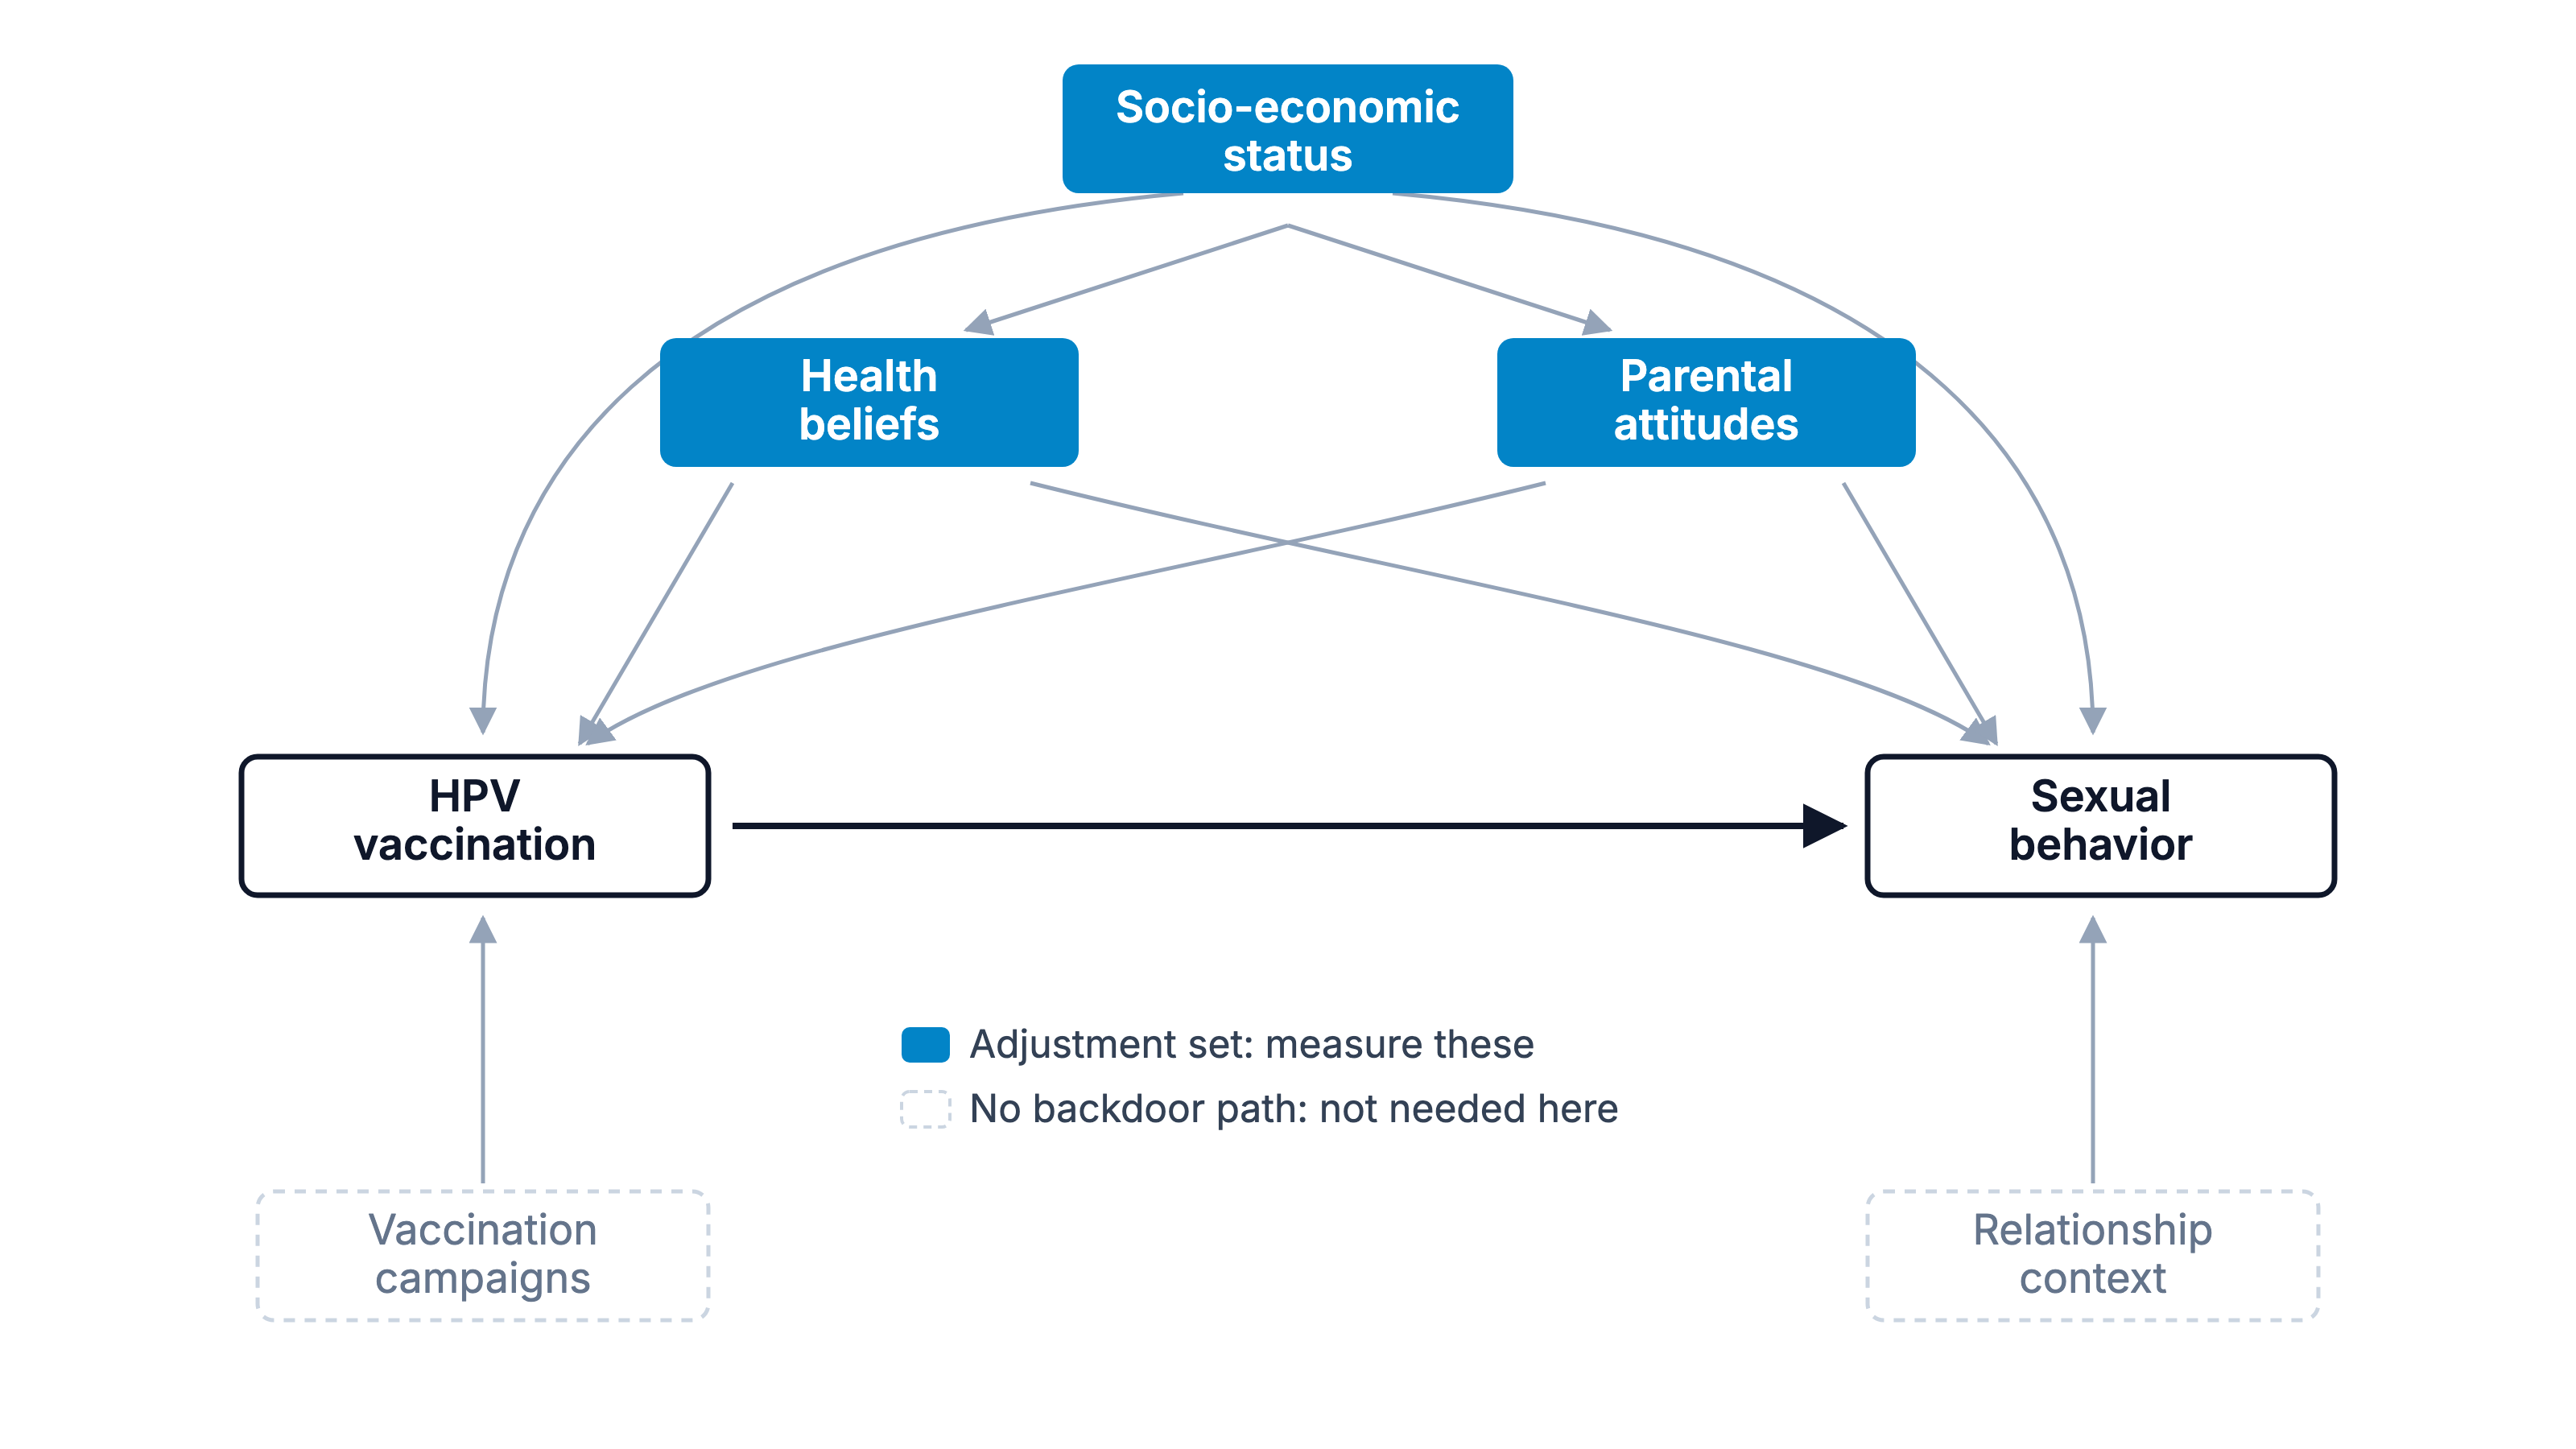
The HPV vaccination DAG with the minimum adjustment set highlighted. Adapted from Chapter 9.
Slide 4
The highlighted nodes are the ones you have to measure
Highlighted in blue
Health beliefs
Parental attitudes
Socio-economic status
Dashed, not needed here
Vaccination campaigns
Relationship context
Neither creates a backdoor path
Slide 5
The DAG has turned a causal problem into a data collection checklist
How will we measure health beliefs?
Is there a validated instrument for parental attitudes in this population?
Can we get reliable socio-economic data?
Slide 6
Inputs, activities, outputs, outcomes, impacts
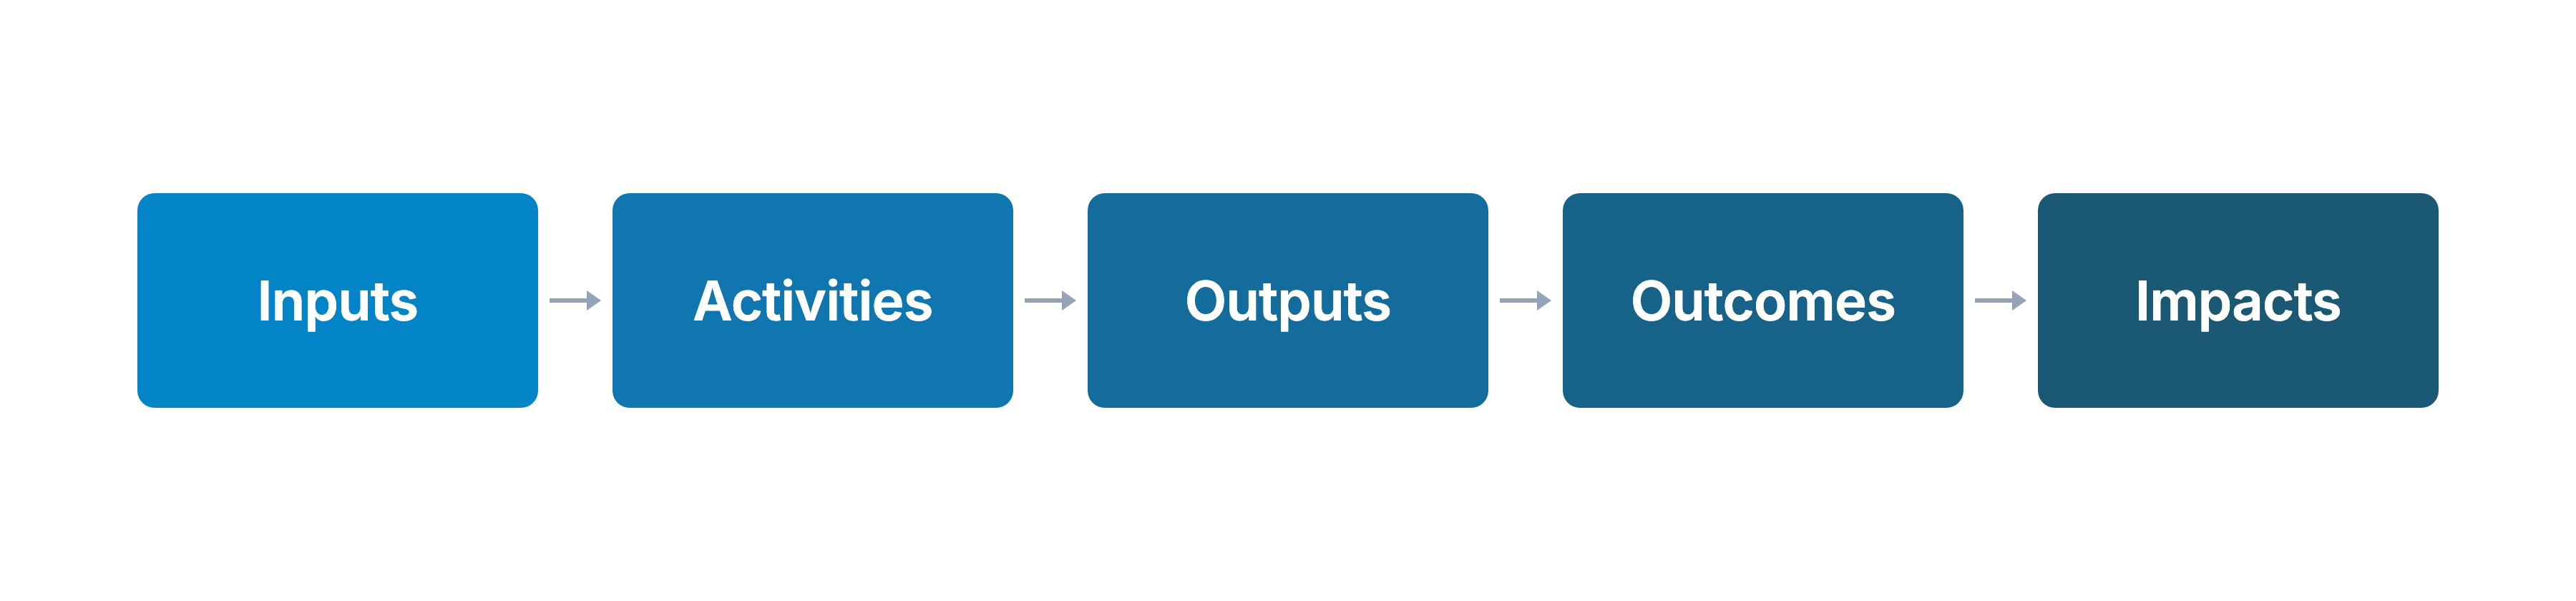
The basic structure of a logic model, read left to right. Adapted from Chapter 9.
Slide 7
A DAG tells you what to control for; a logic model tells you what to monitor
Each box in the chain is something you might need to measure
Did we spend what we planned? Did we deliver as designed? Did outcomes change?
Slide 8
A plausible logic model for the Healthy Activity Program trial
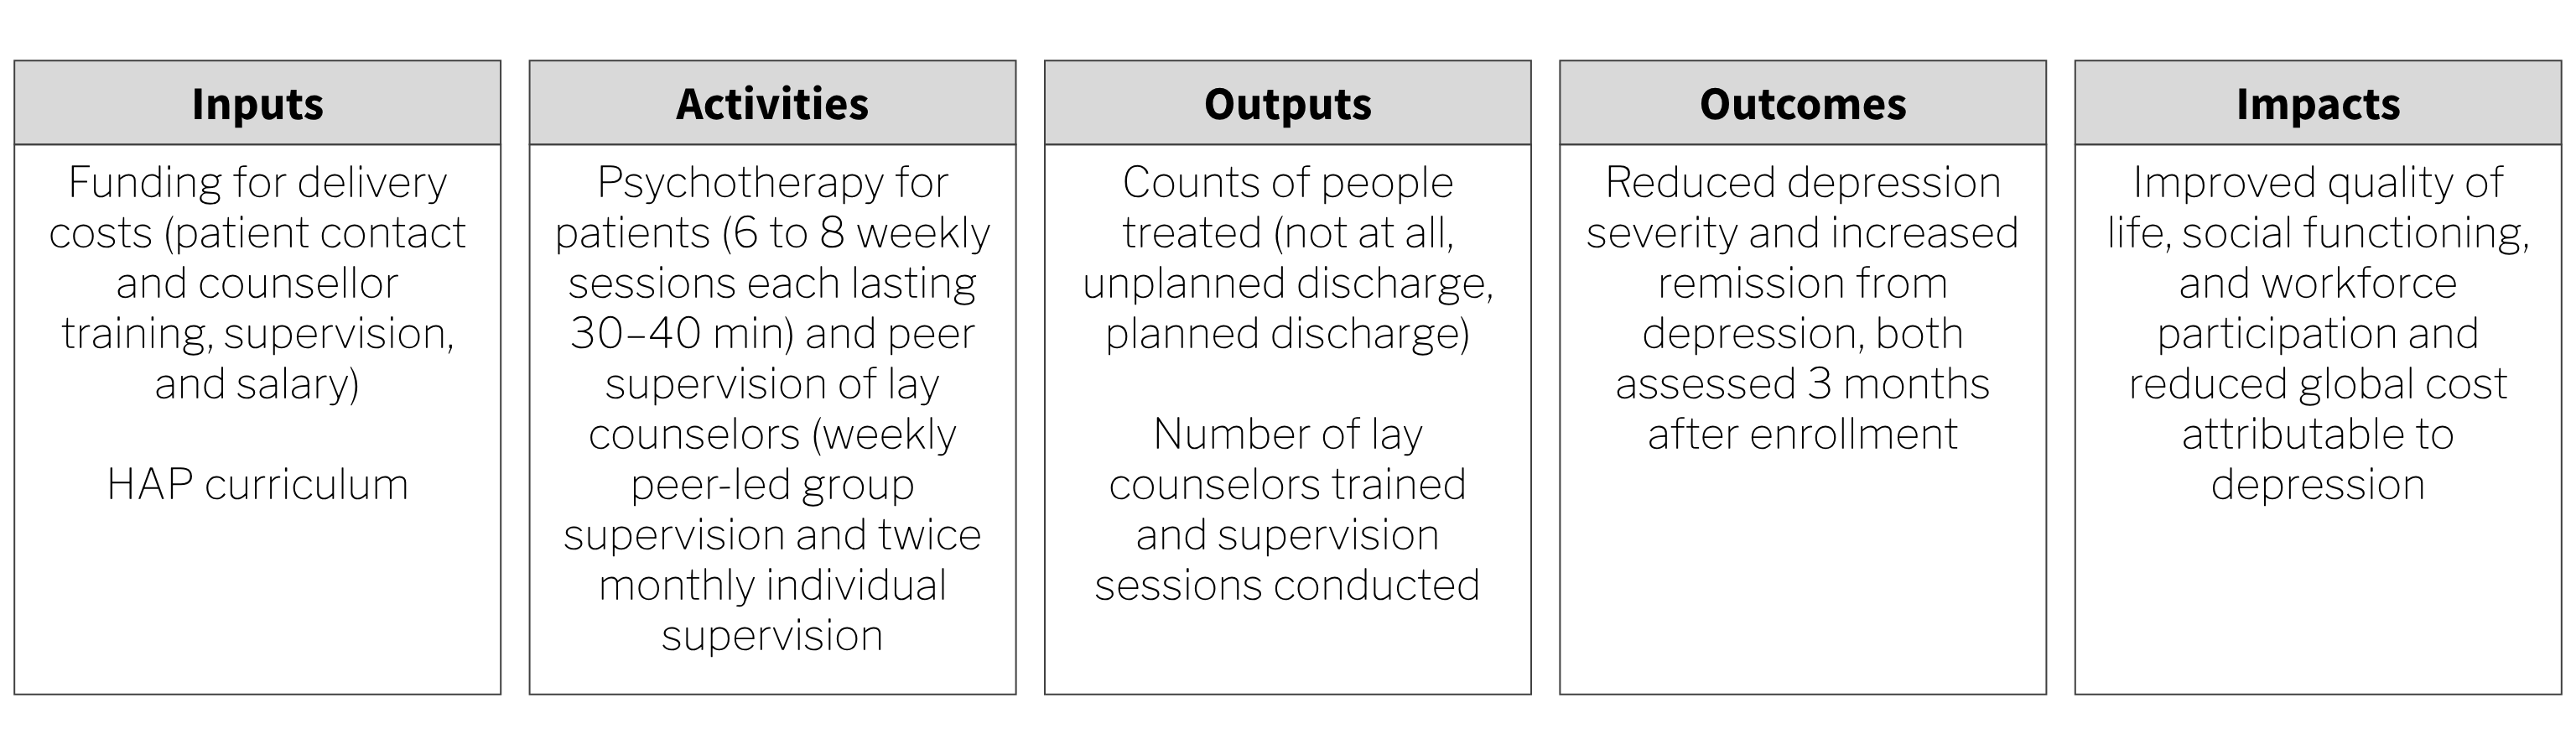
HAP logic model. Reproduced from Chapter 9.
Slide 9
Activities
What you actually do with your inputs
Psychotherapy for patients, and supervision of lay counselors
Individual, face-to-face, over 6 to 8 weekly sessions of 30 to 40 minutes
Weekly peer-led group supervision and twice monthly individual supervision
Slide 10
Outputs
The direct, countable products of your activities
Sessions delivered, people trained, materials distributed
They tell you whether you did what you said you would do
69% of patients had a planned discharge
Slide 11
Treatment fidelity
Was the intervention delivered as intended?
How closely implementation reflects the intended design
External ratings of a randomly selected 10% of all intervention sessions
An expert compared recorded sessions against the manual
Slide 12
Low fidelity usually shrinks treatment effects
If the study shows no effect and fidelity is low, the null may not be valid
Implementation failure rather than theory or program failure could be to blame
Low fidelity also threatens external validity: the study cannot truly be replicated
Slide 13
Patel et al., 2017
Outcomes measure whether it made a difference
"The two primary outcomes were depression severity assessed by the modified"
"Beck Depression Inventory version II (BDI-II) and remission from depression"
"as defined by a PHQ-9 score of less than 10, both assessed 3 months after enrollment."
Slide 14
Impacts
Longer-term changes, rarely tested in a single study
They unfold over years or decades
Improved quality of life for patients and their families
Increased workforce productivity, and reduced costs to society
Slide 15
In Closing
The model produces a list of things to go and measure
Expenditures; measures of treatment fidelity
Counts of therapy sessions completed and supervision sessions held
Measures of depression and several secondary outcomes
From conceptual model to measurement
Slide 1The first step in planning study measurement is to decide what to measure. I always start this process by creating a conceptual model, such as a DAG or a theory of change. Conceptual models can help you identify what data you must collect or obtain to answer your research question.
DAG example
A DAG doubles as a measurement planning tool
Every node tells you something about what data you need to collect
The minimum adjustment set is the smallest group of variables
It blocks all confounding paths between the exposure and the outcome
Slide 2In an earlier chapter I introduced directed acyclic graphs, or DAGs, as tools for mapping causal assumptions. Here I want to show how a DAG doubles as a measurement planning tool: every node tells you something about what data you need to collect. Consider the HPV vaccination example from that chapter. Researchers wanted to estimate the causal effect of HPV vaccination on sexual behavior.
HPV vaccination and sexual behavior
The HPV vaccination DAG with the minimum adjustment set highlighted. Adapted from Chapter 9.
Slide 3This is the DAG for that question, with the minimum adjustment set highlighted in blue: the smallest group of variables that blocks all confounding paths between the exposure and the outcome.
The highlighted nodes are the ones you have to measure
Highlighted in blue
Health beliefs
Parental attitudes
Socio-economic status
Dashed, not needed here
Vaccination campaigns
Relationship context
Neither creates a backdoor path
Slide 4The three highlighted nodes, health beliefs, parental attitudes, and socio-economic status, are the variables we must measure or obtain data on to close the backdoor paths. The two drawn with a dashed outline, vaccination campaigns and relationship context, we don't need for our primary analysis, because they don't create backdoor paths.
The DAG has turned a causal problem into a data collection checklist
How will we measure health beliefs?
Is there a validated instrument for parental attitudes in this population?
Can we get reliable socio-economic data?
Slide 5The DAG has turned a causal inference problem into a data collection checklist. And that checklist forces hard questions: how will we measure health beliefs? Is there a validated instrument for parental attitudes in our study population? Can we get reliable socio-economic data? If the answer to any of these is no, we know before we start that our analysis will have gaps, and we can plan accordingly.
Inputs, activities, outputs, outcomes, impacts
The basic structure of a logic model, read left to right. Adapted from Chapter 9.
Slide 6DAGs are powerful for observational studies where confounding is the central concern. But for intervention studies, where you're testing whether a program or treatment works, a different kind of conceptual model is often more useful for measurement planning: the logic model, sometimes called a theory of change. A logic model maps the hypothesized causal chain from what you put into a program to what you expect to get out of it. It reads left to right, like a story: resources go in, activities happen, products come out, and if everything works as intended, change follows.
A DAG tells you what to control for; a logic model tells you what to monitor
Each box in the chain is something you might need to measure
Did we spend what we planned? Did we deliver as designed? Did outcomes change?
Slide 7Inputs, then activities, then outputs, then outcomes, then impacts. The measurement planning payoff is similar to the DAG: each box in the chain represents something you might need to measure. But whereas a DAG tells you what to control for, a logic model tells you what to monitor and evaluate. It answers a different set of questions: did we spend what we planned to spend? Did we deliver the intervention as designed? Did participants actually receive it? And did the outcomes change?
A plausible logic model for the Healthy Activity Program trial
HAP logic model. Reproduced from Chapter 9.
Slide 8Here is a plausible logic model for the trial. Inputs on the left, impacts on the right, and each box in between represents something you might need to measure.
Activities
What you actually do with your inputs
Psychotherapy for patients, and supervision of lay counselors
Individual, face-to-face, over 6 to 8 weekly sessions of 30 to 40 minutes
Weekly peer-led group supervision and twice monthly individual supervision
Slide 9Activities are what you actually do with your inputs: the services delivered, trainings conducted, or interventions implemented. In a logic model, activities represent the action that's supposed to produce change. The main activities here were psychotherapy for patients and supervision of lay counselors. The program was designed to be delivered in an individual, face-to-face format, by telephone when necessary, over 6 to 8 weekly sessions each lasting 30 to 40 minutes. Supervision consisted of weekly peer-led group supervision and twice monthly individual supervision.
Outputs
The direct, countable products of your activities
Sessions delivered, people trained, materials distributed
They tell you whether you did what you said you would do
69% of patients had a planned discharge
Slide 10Outputs are the direct, countable products of your activities: how many sessions delivered, how many people trained, how many materials distributed. Outputs tell you whether you did what you said you would do, but they don't tell you whether it worked. In this trial the authors counted the number of sessions delivered to patients in the treatment arm, as well as the number of patients who completed the program. Sixty-nine percent had a planned discharge. Presumably they also tracked the number of counselors trained and supervision sessions conducted.
Treatment fidelity
Was the intervention delivered as intended?
How closely implementation reflects the intended design
External ratings of a randomly selected 10% of all intervention sessions
An expert compared recorded sessions against the manual
Slide 11In intervention studies like this, it's important to determine if the intervention was delivered as intended. This is called treatment fidelity, and it's a measure of how closely the actual implementation of a treatment or program reflects the intended design. The study authors measured fidelity in several ways, including external ratings of a randomly selected 10 percent of all intervention sessions. An expert not involved in the program listened to recorded sessions and compared session content against the manual. They also had counselors document the duration of each session.
Low fidelity usually shrinks treatment effects
If the study shows no effect and fidelity is low, the null may not be valid
Implementation failure rather than theory or program failure could be to blame
Low fidelity also threatens external validity: the study cannot truly be replicated
Slide 12Low treatment fidelity usually results in an attenuation, a shrinking, of treatment effects, which is a threat to internal validity. If the study shows no effect but treatment fidelity is low, the null result may not be valid. Implementation failure rather than theory or program failure could be to blame. Low fidelity is also a threat to external validity, because it is not possible to truly replicate the study.
Patel et al., 2017
Outcomes measure whether it made a difference
"The two primary outcomes were depression severity assessed by the modified"
"Beck Depression Inventory version II (BDI-II) and remission from depression"
"as defined by a PHQ-9 score of less than 10, both assessed 3 months after enrollment."
Slide 13Outcomes are the changes you hope to see as a result of your activities: the so-what of your work. Unlike outputs, which count what you did, outcomes measure whether it made a difference. The hypothesized outcome in this study was a reduction in depression. The authors registered two primary outcomes: depression severity, assessed with the modified Beck Depression Inventory, and remission from depression, defined by a score below ten on the Patient Health Questionnaire, both assessed three months after enrollment.
Impacts
Longer-term changes, rarely tested in a single study
They unfold over years or decades
Improved quality of life for patients and their families
Increased workforce productivity, and reduced costs to society
Slide 14Impacts are the longer-term changes you believe will result from achieving your outcomes, and they're often not directly tested in a single study. They unfold over years or decades, making them difficult to measure within a typical research timeframe. The authors assumed that the long-term impact of reducing depression at scale would be improvements in quality of life for patients and their families, increased workforce productivity, and a reduction in costs to society.
In Closing
The model produces a list of things to go and measure
Expenditures; measures of treatment fidelity
Counts of therapy sessions completed and supervision sessions held
Measures of depression and several secondary outcomes
Slide 15Logic models and DAGs provide a solid foundation for measurement planning. If you or I were designing this study, the logic model would tell us that we need to collect or obtain data on expenditures, on measures of treatment fidelity, on counts of therapy sessions completed and supervision sessions held, and on measures of depression and several secondary outcomes. Generating this list is the first step. The next step is figuring out the specifics of measurement.