Chapter 9 · Video 4
Indexes and scales
Print layout
Slide 1


Indexes and scales
Slide 2
Indexes and scales combine items into one score, differently
Index
The items collectively define the construct
Remove an item and the construct changes
Scale
The items reflect an underlying construct
It exists independently of any single item
Slide 3
The arrows point in opposite directions
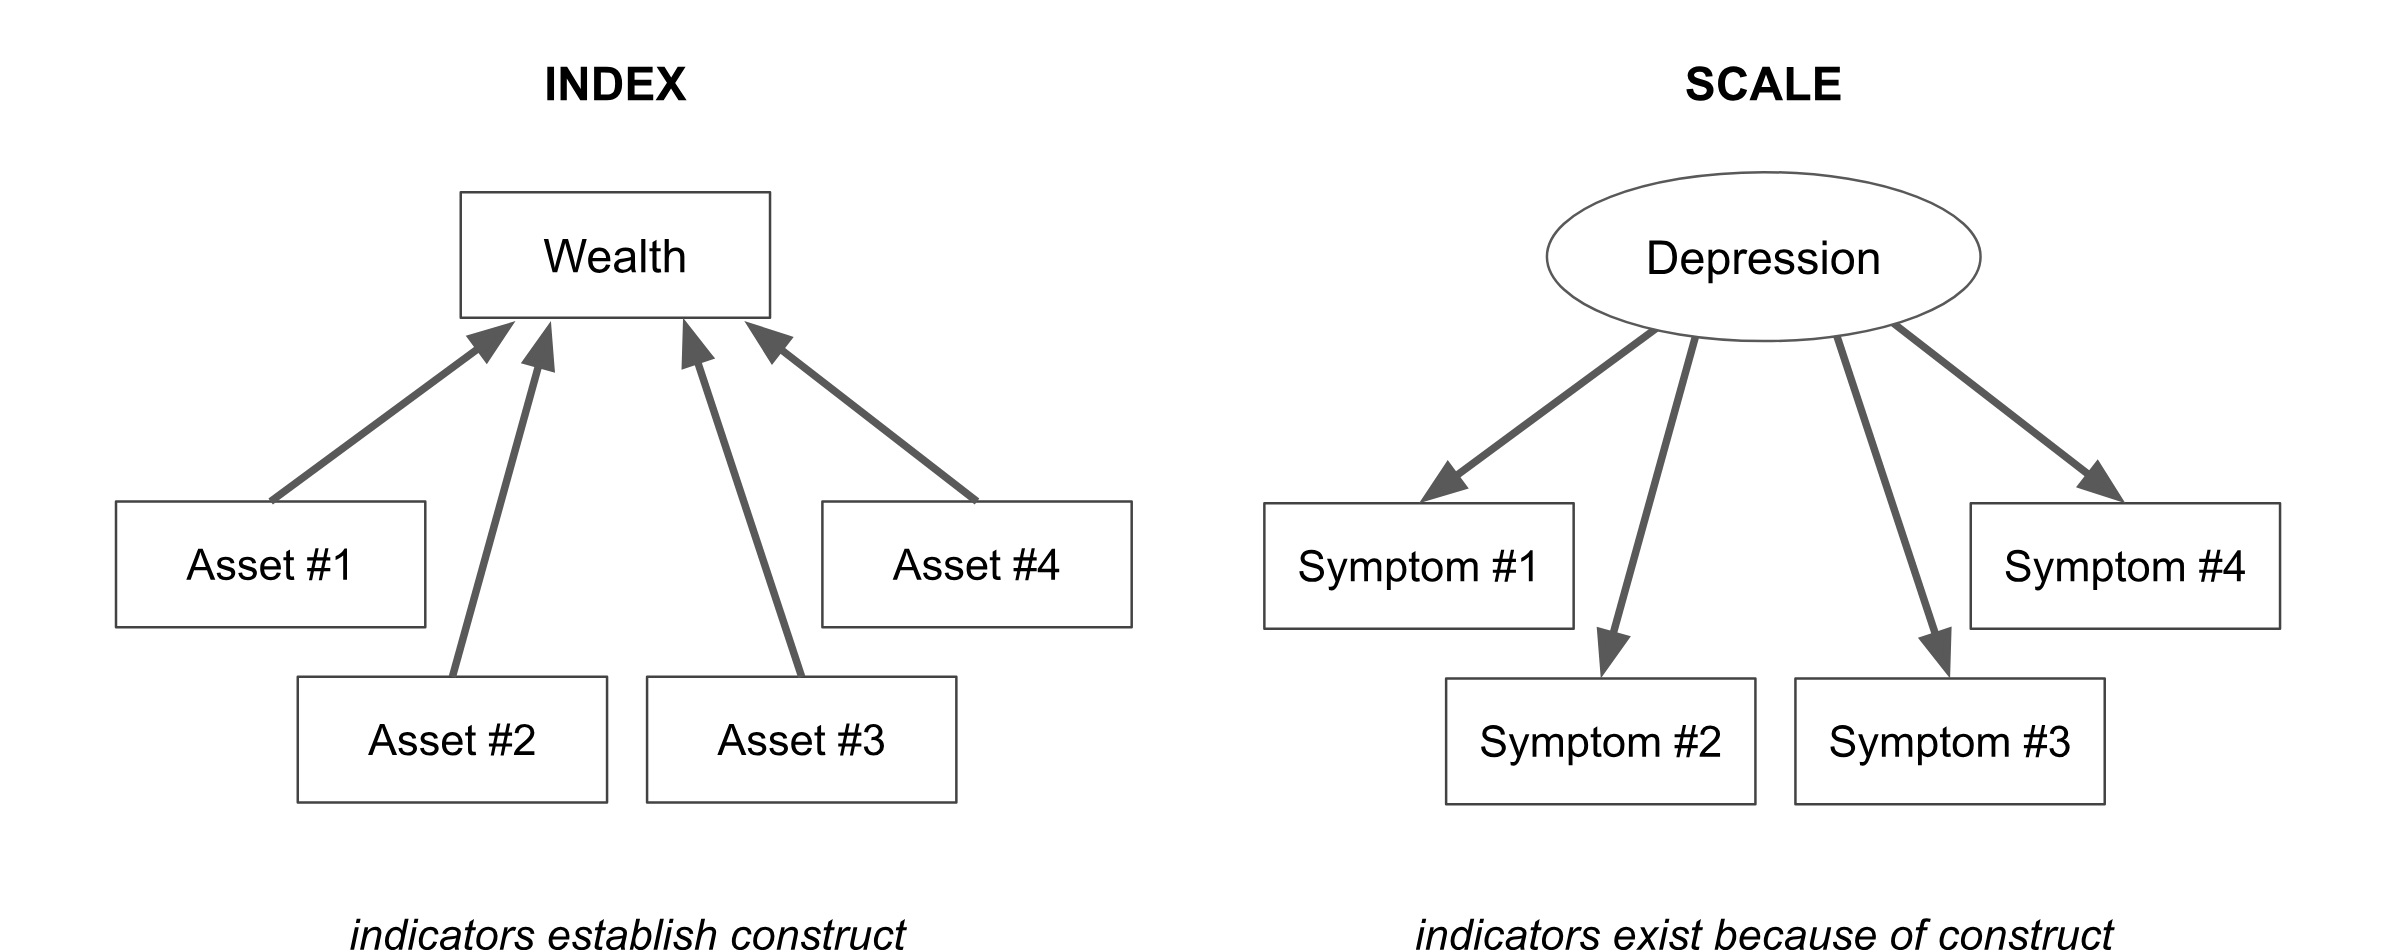
Scale vs index. Reproduced from Chapter 9.
Slide 4
Index
A household's wealth is the sum of its assets
Phone, television, car, land ownership, dwelling characteristics
Water and sanitation, housing materials, persons sleeping per room
In the DHS wealth index the weights come from principal component analysis
Slide 5
Scale
The symptoms do not define depression
Sadness, fatigue, loss of appetite are observable expressions of it
Two people with the same severity might show different symptom patterns
Items that stem from a common latent cause should be intercorrelated
Slide 6
Twenty items, and how they moved together
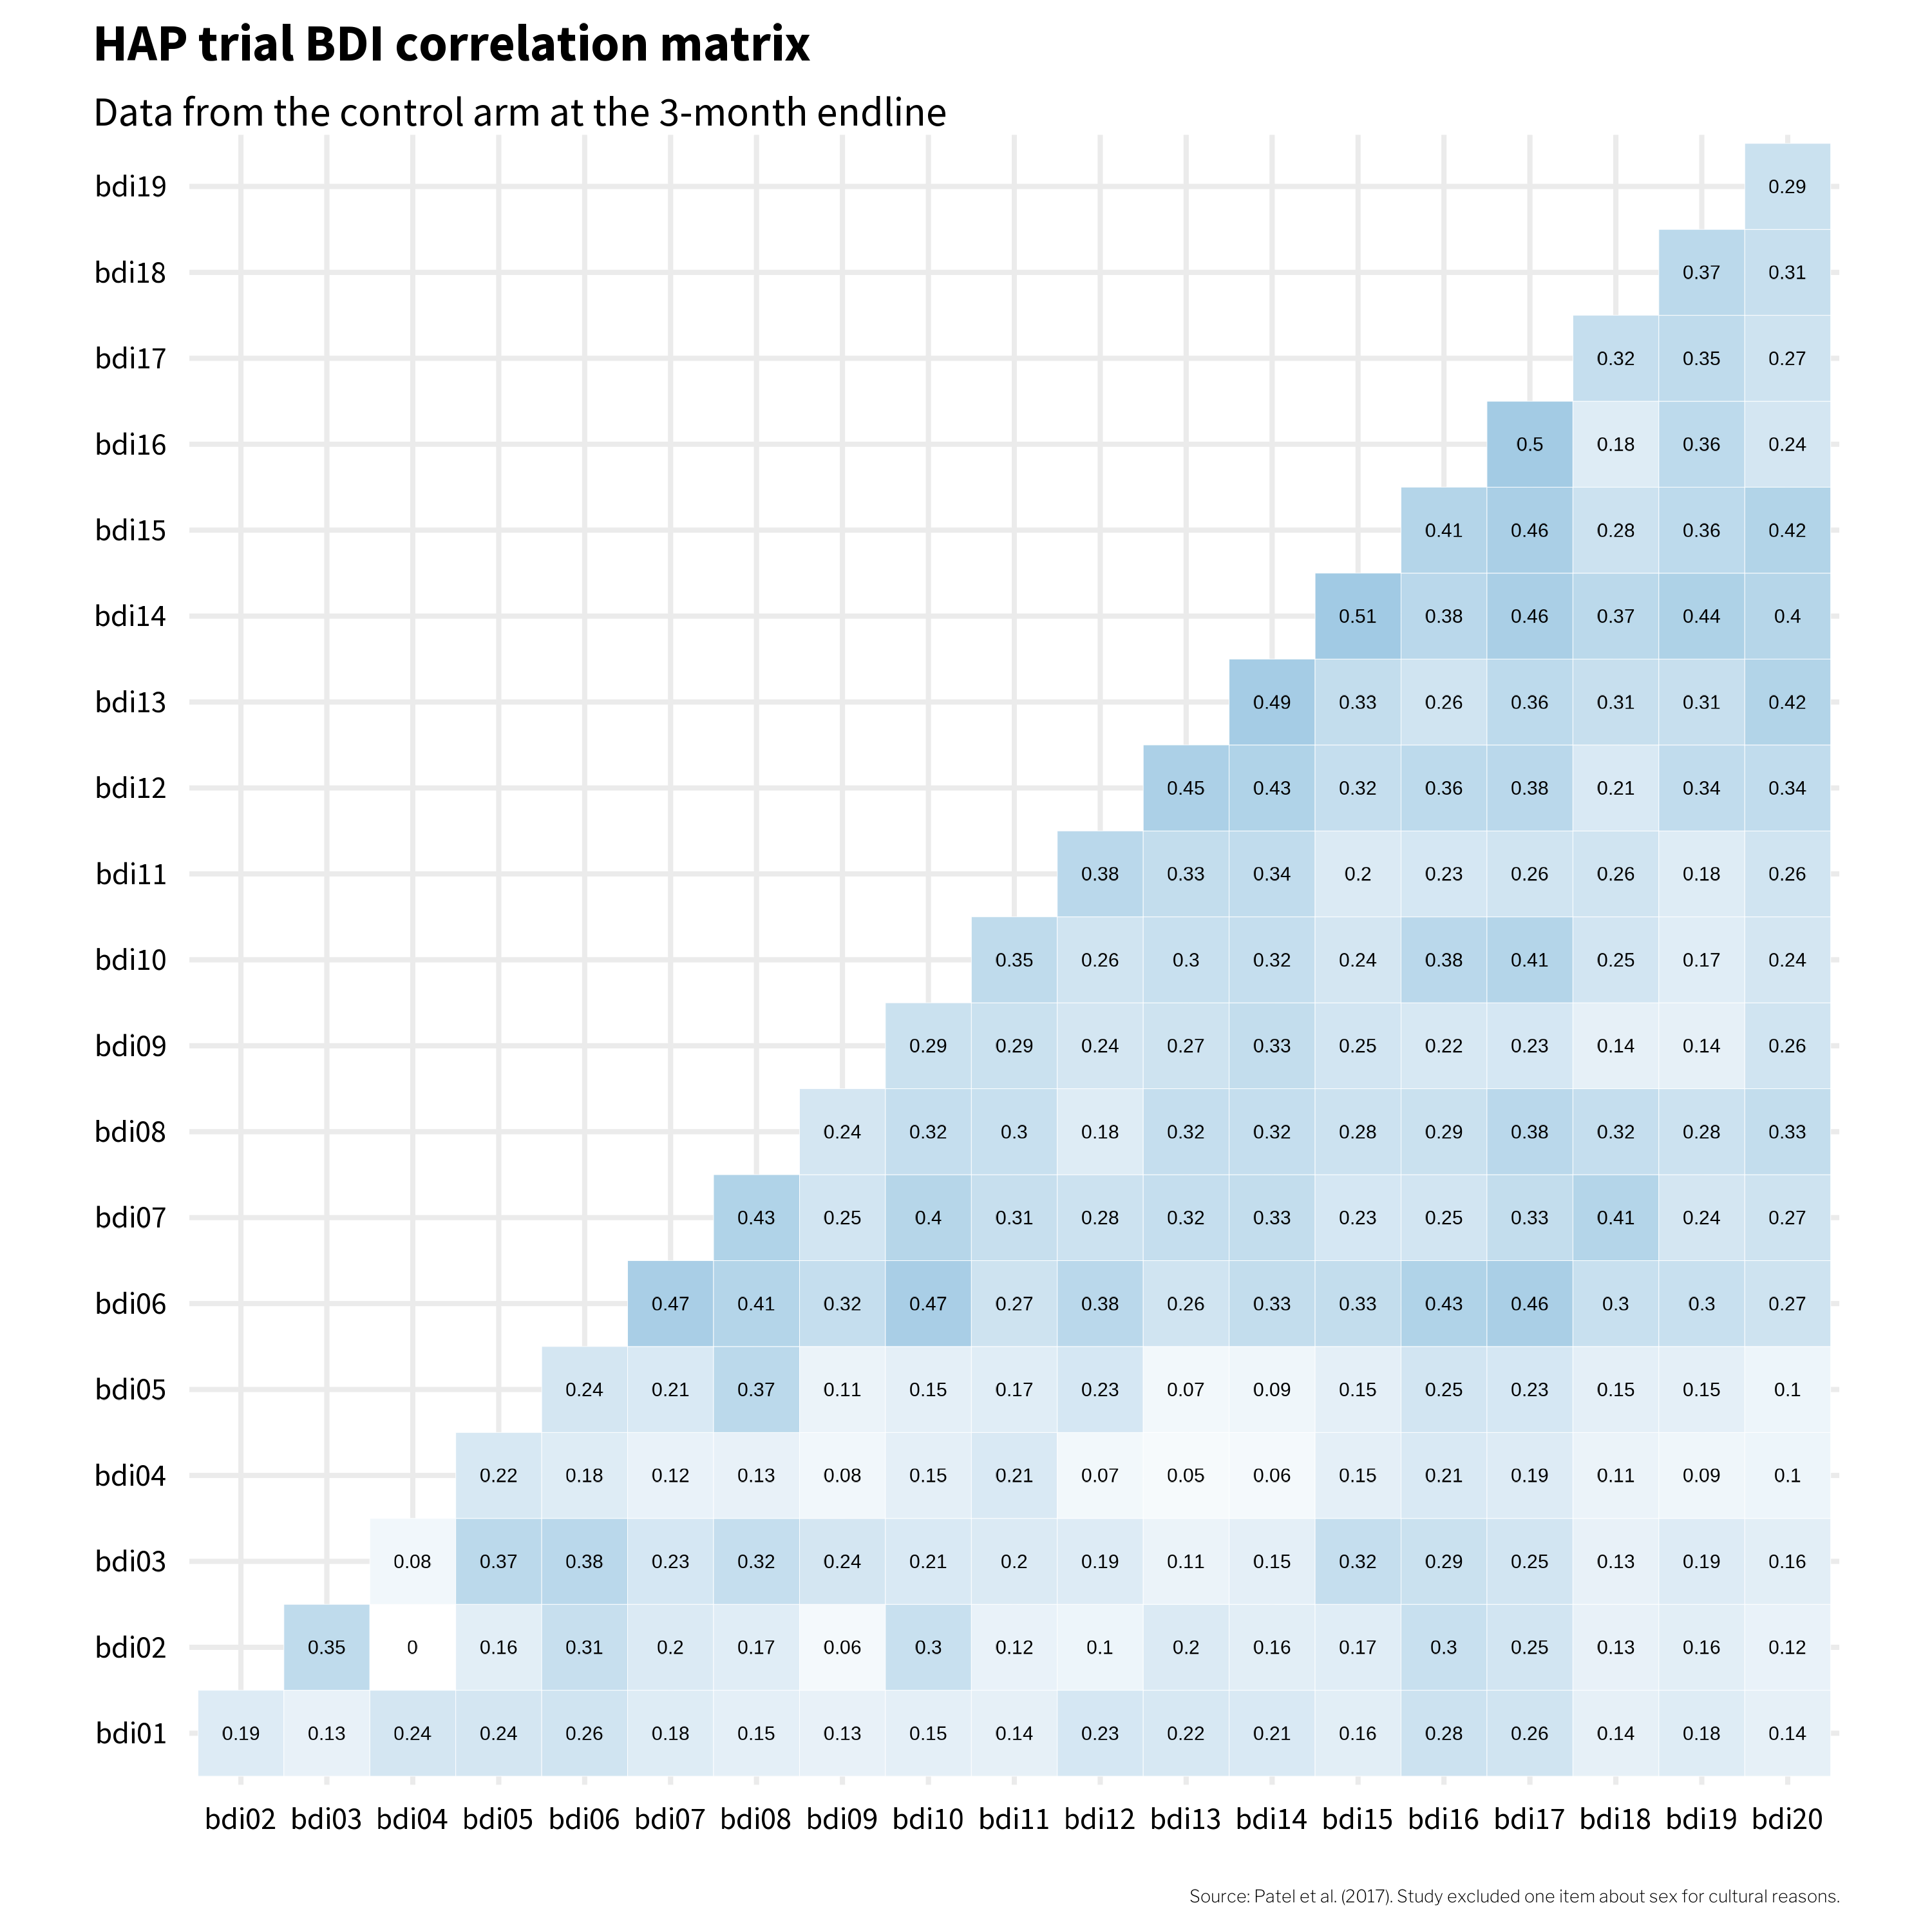
BDI-II correlations in the HAP trial. Patel et al. (2017) excluded one item about sex for cultural reasons, so 20 of the 21 questions were used. Reproduced from Chapter 9.
Slide 7
Most item pairs correlate in the 0.2 to 0.3 range
Endorse one symptom and you tend to endorse others: a common cause is driving it
But bdi04, changes in appetite, is essentially uncorrelated with bdi02, tiredness
Appetite may not travel with the other symptoms the way the designers assumed
Slide 8
Scale construction
Should feeling sad count the same as feeling suicidal?
Equal weighting is the most common approach
Each item is scored 0 to 3 and simply summed
A severity score ranging from 0 to 63, and no fancy math required
Slide 9
Four people, twenty items, one column of totals

Equal weighting in the BDI-II. Each row is a participant; each column is an item scored 0-3. The final column is the sum of all item scores. Reproduced from Chapter 9.
Slide 10
McNeish, 2020
Scales could use optimal weighting instead
A factor model weights items more heavily when they relate more closely to the construct
Congeneric: each item relates to the construct with its own unique strength
The alternative forces every item to contribute equally
Slide 11
One latent factor, twenty loadings, each estimated on its own

Path diagram of a congeneric factor model for the BDI-II fit to data from the HAP trial control arm at the 3-month endline. Reproduced from Chapter 9.
Slide 12
Failure and indecisiveness load highest; appetite lowest
bdi14 (feeling like a failure) and bdi17 (indecisiveness) load highest at 0.76
Those two items contribute the most to the overall factor score
bdi04 (changes in appetite) has the weakest relationship, and contributes least
Slide 13
If the two methods agreed, every point would sit on a line
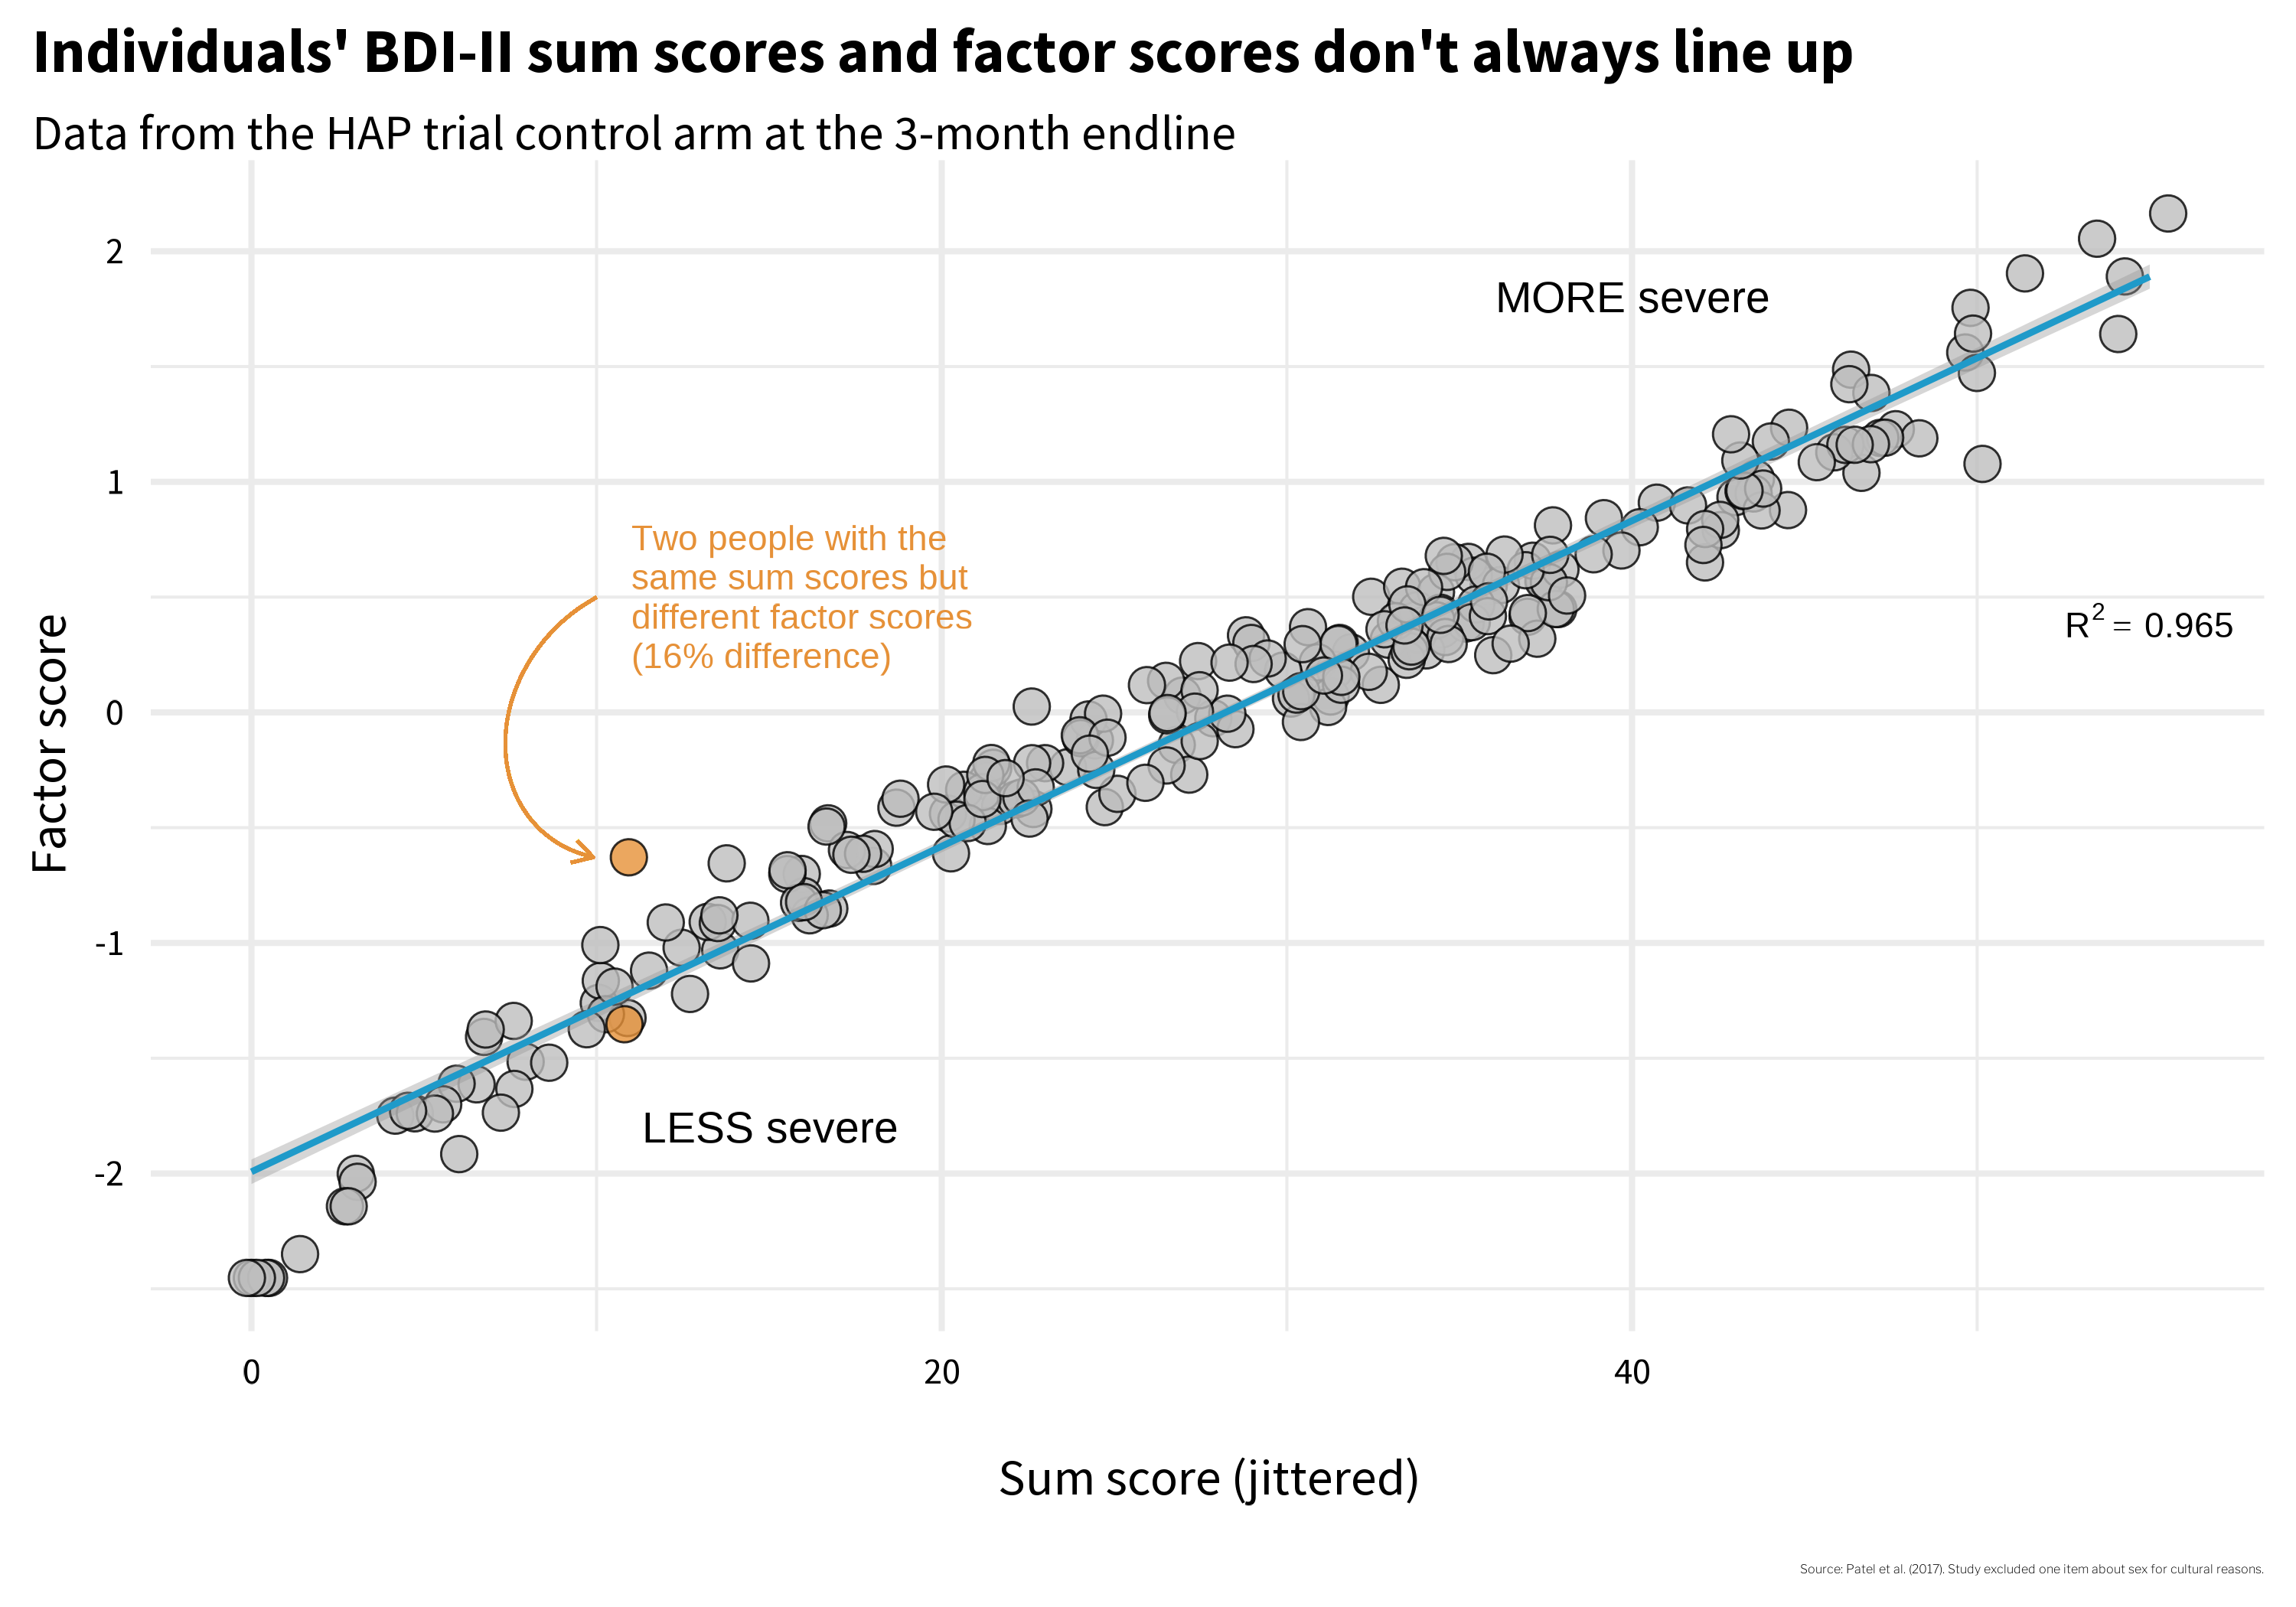
Sum scores vs factor scores in the HAP trial. Each point is one participant. The two orange points are Person A and Person B: identical sum scores, different factor scores. Reproduced from Chapter 9.
Slide 14
The pattern of endorsement is what separates them
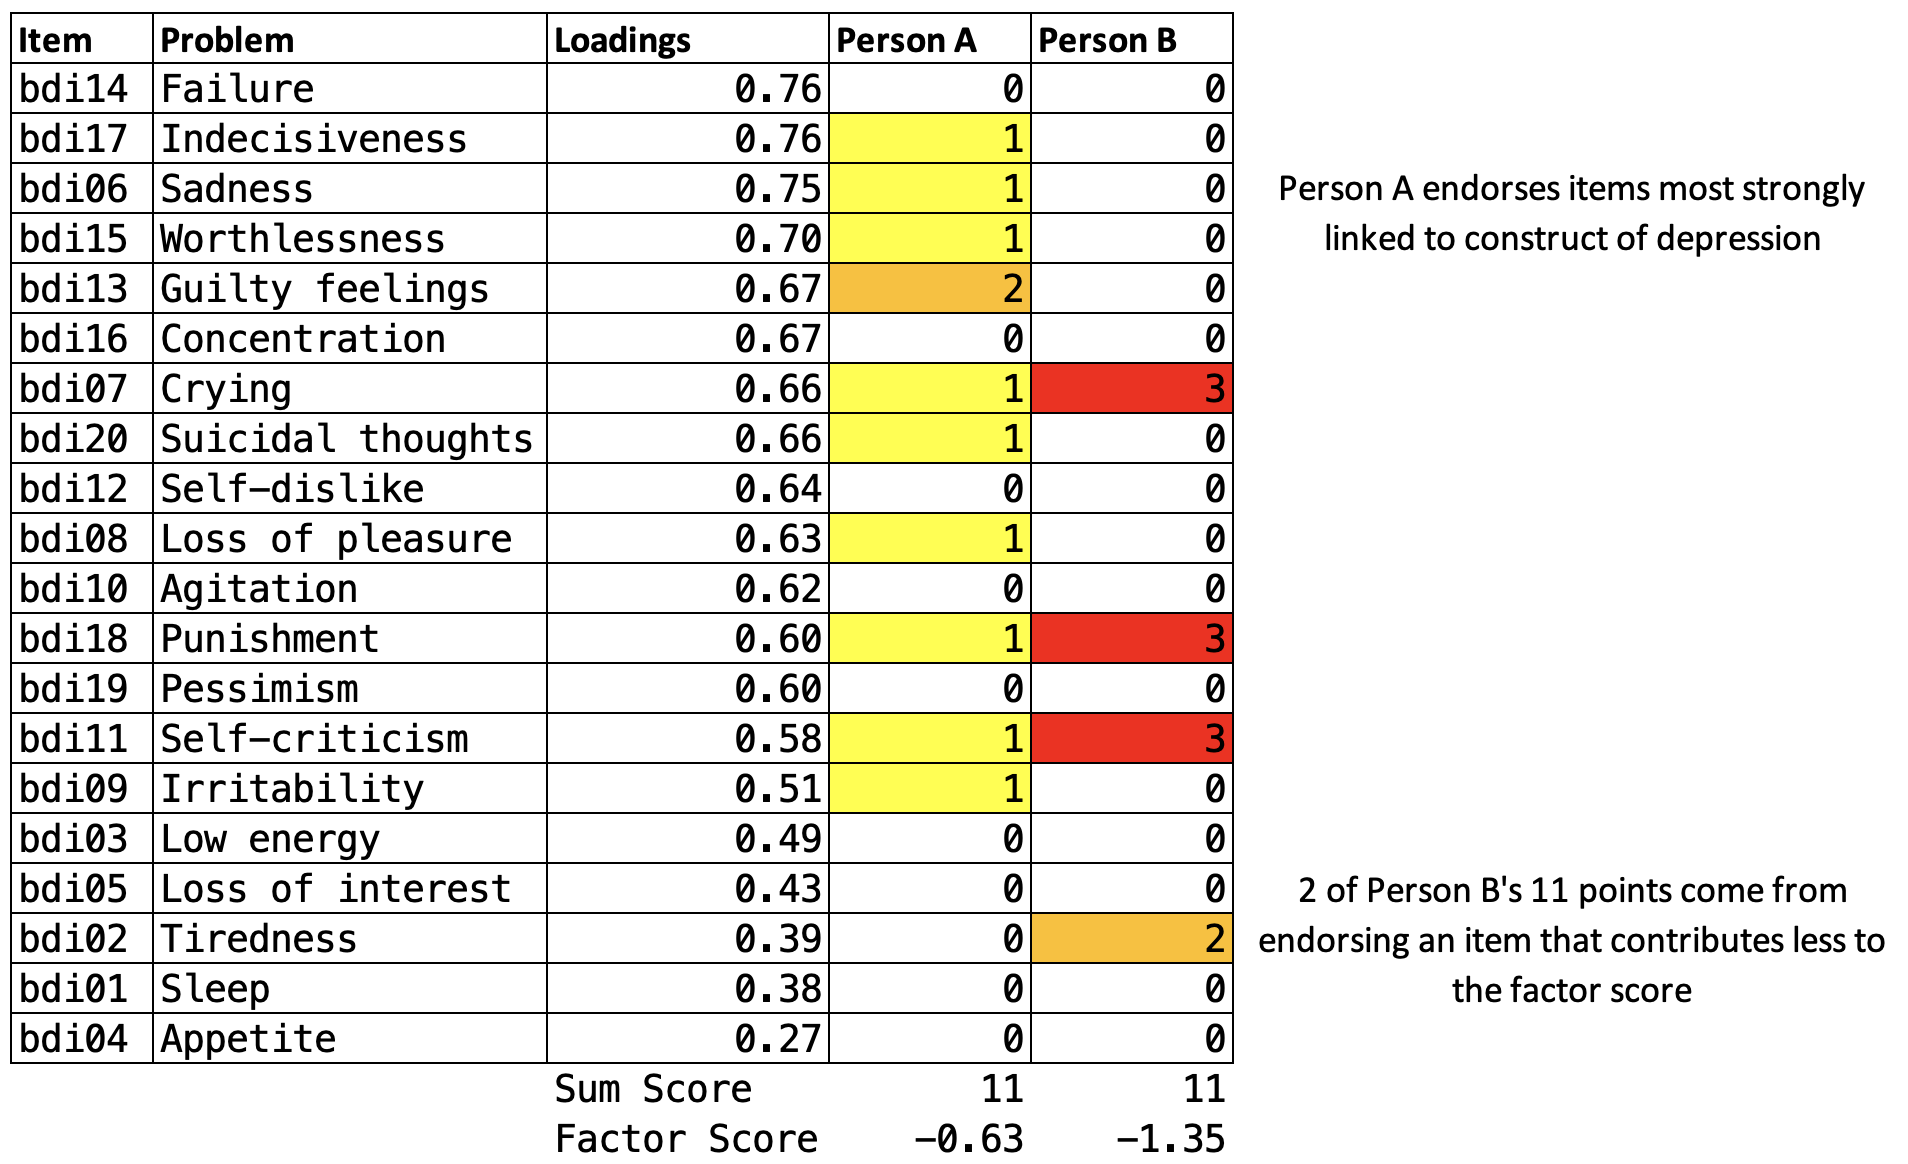
Item-level responses for Person A and Person B. Both have identical sum scores (11), but Person A endorsed items with higher factor loadings. Reproduced from Chapter 9.
Slide 15
There is no universally correct answer
Sum scores
Transparent and easy to calculate
Comparable across studies
Once the only practical option
Factor scores
Weight items by their loading
Often derived from sample-specific weights
Cross-study comparison gets harder
Slide 16
In Closing
How you construct an indicator shapes what it captures
Two identical numbers can represent meaningfully different experiences
What items are essential? How should they be combined into one score?
And how do you know the number represents the construct you meant to measure?
Indexes and scales
Slide 1Indexes and scales combine multiple items into a single score. The key difference between them lies in the relationship between items and constructs.
Indexes and scales combine items into one score, differently
Index
The items collectively define the construct
Remove an item and the construct changes
Scale
The items reflect an underlying construct
It exists independently of any single item
Slide 2In an index, the items collectively define the construct. Add or remove an item and the construct itself changes. In a scale, the items reflect an underlying construct that exists independently of any single item.
The arrows point in opposite directions
Scale vs index. Reproduced from Chapter 9.
Slide 3That difference is easiest to see as arrows. On the left, the arrows run from the items up to the construct: the indicators establish it. On the right, they run from the construct down to the items: the indicators exist because of it.
Index
A household's wealth is the sum of its assets
Phone, television, car, land ownership, dwelling characteristics
Water and sanitation, housing materials, persons sleeping per room
In the DHS wealth index the weights come from principal component analysis
Slide 4An index combines items that collectively define the construct. The items don't reflect some underlying thing that exists independently; they constitute it. Wealth is a good example. A household's wealth is the sum of its assets: livestock, housing quality, appliances. Add more assets, and wealth increases by definition. The DHS wealth index uses household survey data on assets as a measure of household economic status. Asset variables include phones, televisions and cars, land ownership, and dwelling characteristics such as water and sanitation facilities, housing materials, persons sleeping per room, and cooking facilities. A household's wealth score is the weighted sum of the assets it owns, and in this case the weights are derived from the data using principal component analysis, though simpler approaches like equal weighting are also common.
Scale
The symptoms do not define depression
Sadness, fatigue, loss of appetite are observable expressions of it
Two people with the same severity might show different symptom patterns
Items that stem from a common latent cause should be intercorrelated
Slide 5Scales work differently. They combine items that reflect an underlying construct rather than define it. Depression manifests in symptoms, sadness, fatigue, loss of appetite, but the symptoms don't define depression; they're observable expressions of it. Two people with the same underlying depression severity might show different symptom patterns. Because scale items stem from a common, latent cause, they should be intercorrelated.
Twenty items, and how they moved together
BDI-II correlations in the HAP trial. Patel et al. (2017) excluded one item about sex for cultural reasons, so 20 of the 21 questions were used. Reproduced from Chapter 9.
Slide 6The modified inventory used in the HAP trial in India was designed to measure depression with 20 related items asking people to report on their experience of common symptoms. This is how those items were correlated in the trial data. Every square is one pair of items.
Most item pairs correlate in the 0.2 to 0.3 range
Endorse one symptom and you tend to endorse others: a common cause is driving it
But bdi04, changes in appetite, is essentially uncorrelated with bdi02, tiredness
Appetite may not travel with the other symptoms the way the designers assumed
Slide 7If these 20 items all reflect the same underlying construct, depression, then we'd expect them to be positively correlated with each other. And mostly, they are. The darker squares show that most item pairs correlate in the 0.2 to 0.3 range. That's a good sign: when someone endorses one symptom, they tend to endorse others too, which is what we'd expect if a common cause is driving the responses. But look at the appetite item. It's essentially uncorrelated with the tiredness item and only weakly correlated with everything else. That's a clue worth paying attention to. It suggests that in this population, changes in appetite may not travel with the other symptoms of depression the way the instrument's designers assumed. Keep it in mind. It's going to keep showing up as we dig deeper into this instrument's structure.
Scale construction
Should feeling sad count the same as feeling suicidal?
Equal weighting is the most common approach
Each item is scored 0 to 3 and simply summed
A severity score ranging from 0 to 63, and no fancy math required
Slide 8Once you've identified the items that will make up your scale, a key decision is how to combine them into a single score. Should feeling sad count the same as feeling suicidal? The most common approach is equal weighting. Responses to each item are scored 0 to 3 and simply summed to create a depression severity score ranging from 0 to 63.
Four people, twenty items, one column of totals
Equal weighting in the BDI-II. Each row is a participant; each column is an item scored 0-3. The final column is the sum of all item scores. Reproduced from Chapter 9.
Slide 9Here is data from four people in the study. Each row is a participant, each column is an item, and the last column is the total. Each item contributes equally to that sum. No fancy math required.
McNeish, 2020
Scales could use optimal weighting instead
A factor model weights items more heavily when they relate more closely to the construct
Congeneric: each item relates to the construct with its own unique strength
The alternative forces every item to contribute equally
Slide 10But scales like this one could use optimal weighting instead. One alternative approach uses a factor model, where items more closely related to the construct are weighted more heavily. The model is called congeneric, which just means that each item is free to relate to the underlying construct with its own unique strength, rather than being forced to contribute equally.
One latent factor, twenty loadings, each estimated on its own
Path diagram of a congeneric factor model for the BDI-II fit to data from the HAP trial control arm at the 3-month endline. Reproduced from Chapter 9.
Slide 11This is the path diagram for that model. Depression severity sits at the top as a latent variable, and the loadings running down to each of the 20 items are uniquely estimated.
Failure and indecisiveness load highest; appetite lowest
bdi14 (feeling like a failure) and bdi17 (indecisiveness) load highest at 0.76
Those two items contribute the most to the overall factor score
bdi04 (changes in appetite) has the weakest relationship, and contributes least
Slide 12The item about feeling like a failure and the item about indecisiveness have the highest loading, 0.76, meaning these items are most closely related to the construct of depression severity. They contribute the most to the overall factor score. Changes in appetite has the weakest relationship to the construct, and contributes the least.
If the two methods agreed, every point would sit on a line
Sum scores vs factor scores in the HAP trial. Each point is one participant. The two orange points are Person A and Person B: identical sum scores, different factor scores. Reproduced from Chapter 9.
Slide 13Does it matter which construction method you choose? This figure plots every participant's sum score, equal weighting, just add up the responses, on the horizontal axis, against their factor score, optimal weighting, on the vertical axis. If the two methods told the same story, every point would fall on a straight line. Many do, but some don't. Look at the two orange points. Person A and Person B both have a sum score of 11, but their factor scores diverge. Person A scores minus 0.63, while Person B scores minus 1.35. Same raw total, two different pictures of depression severity. Which one is right?
The pattern of endorsement is what separates them
Item-level responses for Person A and Person B. Both have identical sum scores (11), but Person A endorsed items with higher factor loadings. Reproduced from Chapter 9.
Slide 14Why do they differ? This shows each person's item-level responses, and the answer jumps out. Person A endorsed several items with high factor loadings, the items that carry the most weight in the factor model. Person B put the same eleven points into only four items, and two of those points came from tiredness, which carries one of the lowest loadings in the model. Same sum score, but the pattern of endorsement matters when items contribute unequally. This is a validity issue. How you calculate the score changes what the number means.
There is no universally correct answer
Sum scores
Transparent and easy to calculate
Comparable across studies
Once the only practical option
Factor scores
Weight items by their loading
Often derived from sample-specific weights
Cross-study comparison gets harder
Slide 15So do these two people have the same level of depression severity, as their identical sum scores suggest? Or are they experiencing different levels, as the factor scores imply? There's no universally correct answer. For a long time, simplicity was a necessity. Practitioners administered questionnaires on paper and hand-scored them, so no fancy math was possible. Sum scores were not just convenient; they were the only practical option. And there's still value in that simplicity: sum scores are transparent, easy to calculate, and comparable across studies. Factor scores, by contrast, are often derived from sample-specific weights, making cross-study comparisons more complicated.
In Closing
How you construct an indicator shapes what it captures
Two identical numbers can represent meaningfully different experiences
What items are essential? How should they be combined into one score?
And how do you know the number represents the construct you meant to measure?
Slide 16The Person A and Person B example illustrates a broader point. Two identical numbers can represent meaningfully different experiences. How you construct an indicator shapes what it captures, and what it obscures. Which brings us back to the core questions you'll face when measuring any construct: what items are essential to capture the construct? How should you combine multiple items into a single score? And how do you know that the resulting number actually represents the construct you intended to measure? That last question, how do you know, is the focus of everything that follows.