Chapter 7 · Video 6
Instrument-based approaches
Print layout
Slide 1


Instrument-based approaches
Slide 2
Experiments close every backdoor
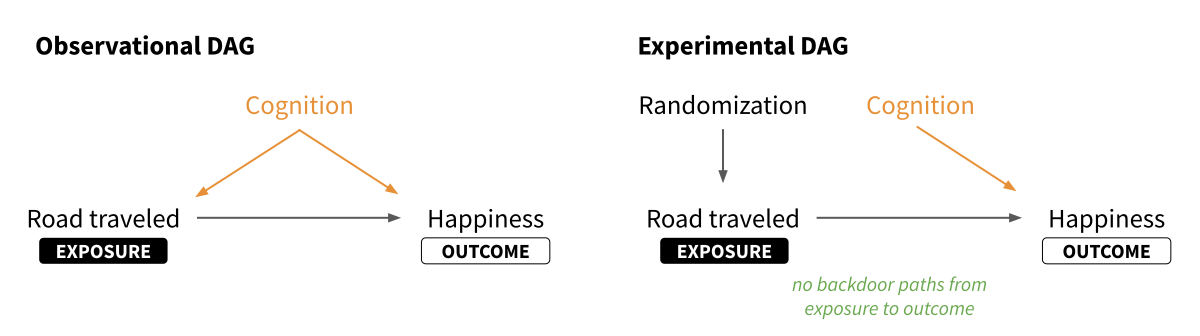
Observational DAG versus experimental DAG. Under randomization, the only arrow into road traveled is randomization itself. Reproduced from Chapter 7.
Slide 3
Randomization destroys confounding
Including confounding from variables you thought to measure, like `cognition`
And from variables you can't or don't measure, for whatever reason
Which is why experiments get called the gold standard
Slide 4
Look for a partial cause of the exposure, unrelated to the outcome
When randomization is not possible, confounding is likely
Confounder-control accounts for it statistically
An exogenous source of variation can identify the effect instead
Slide 5
Suppose access to the road turned on your birthdate
Born on or after January 1, 1980 — you may pass
Born December 31, 1979 — take the road more traveled
The basic setup for a regression discontinuity design
Slide 6
The instrument sits upstream of the exposure
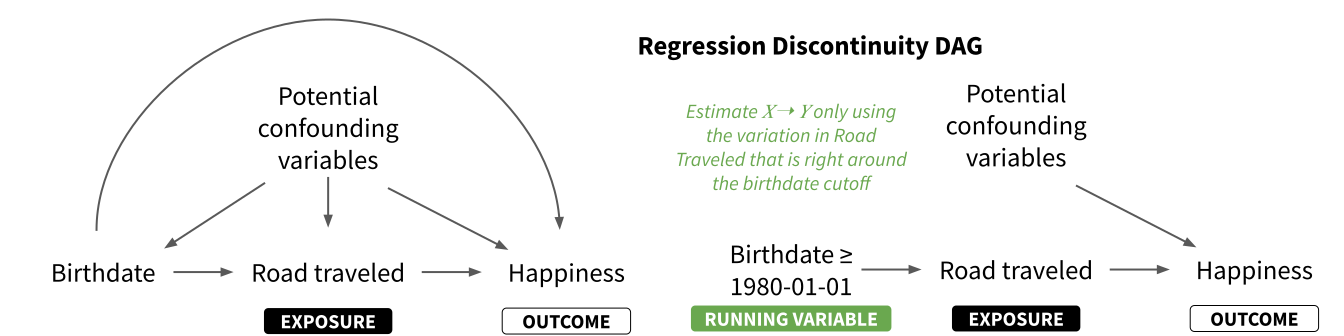
Regression discontinuity DAG. Reproduced from Chapter 7.
Slide 7
A sharp cutoff, and the rule was strictly followed
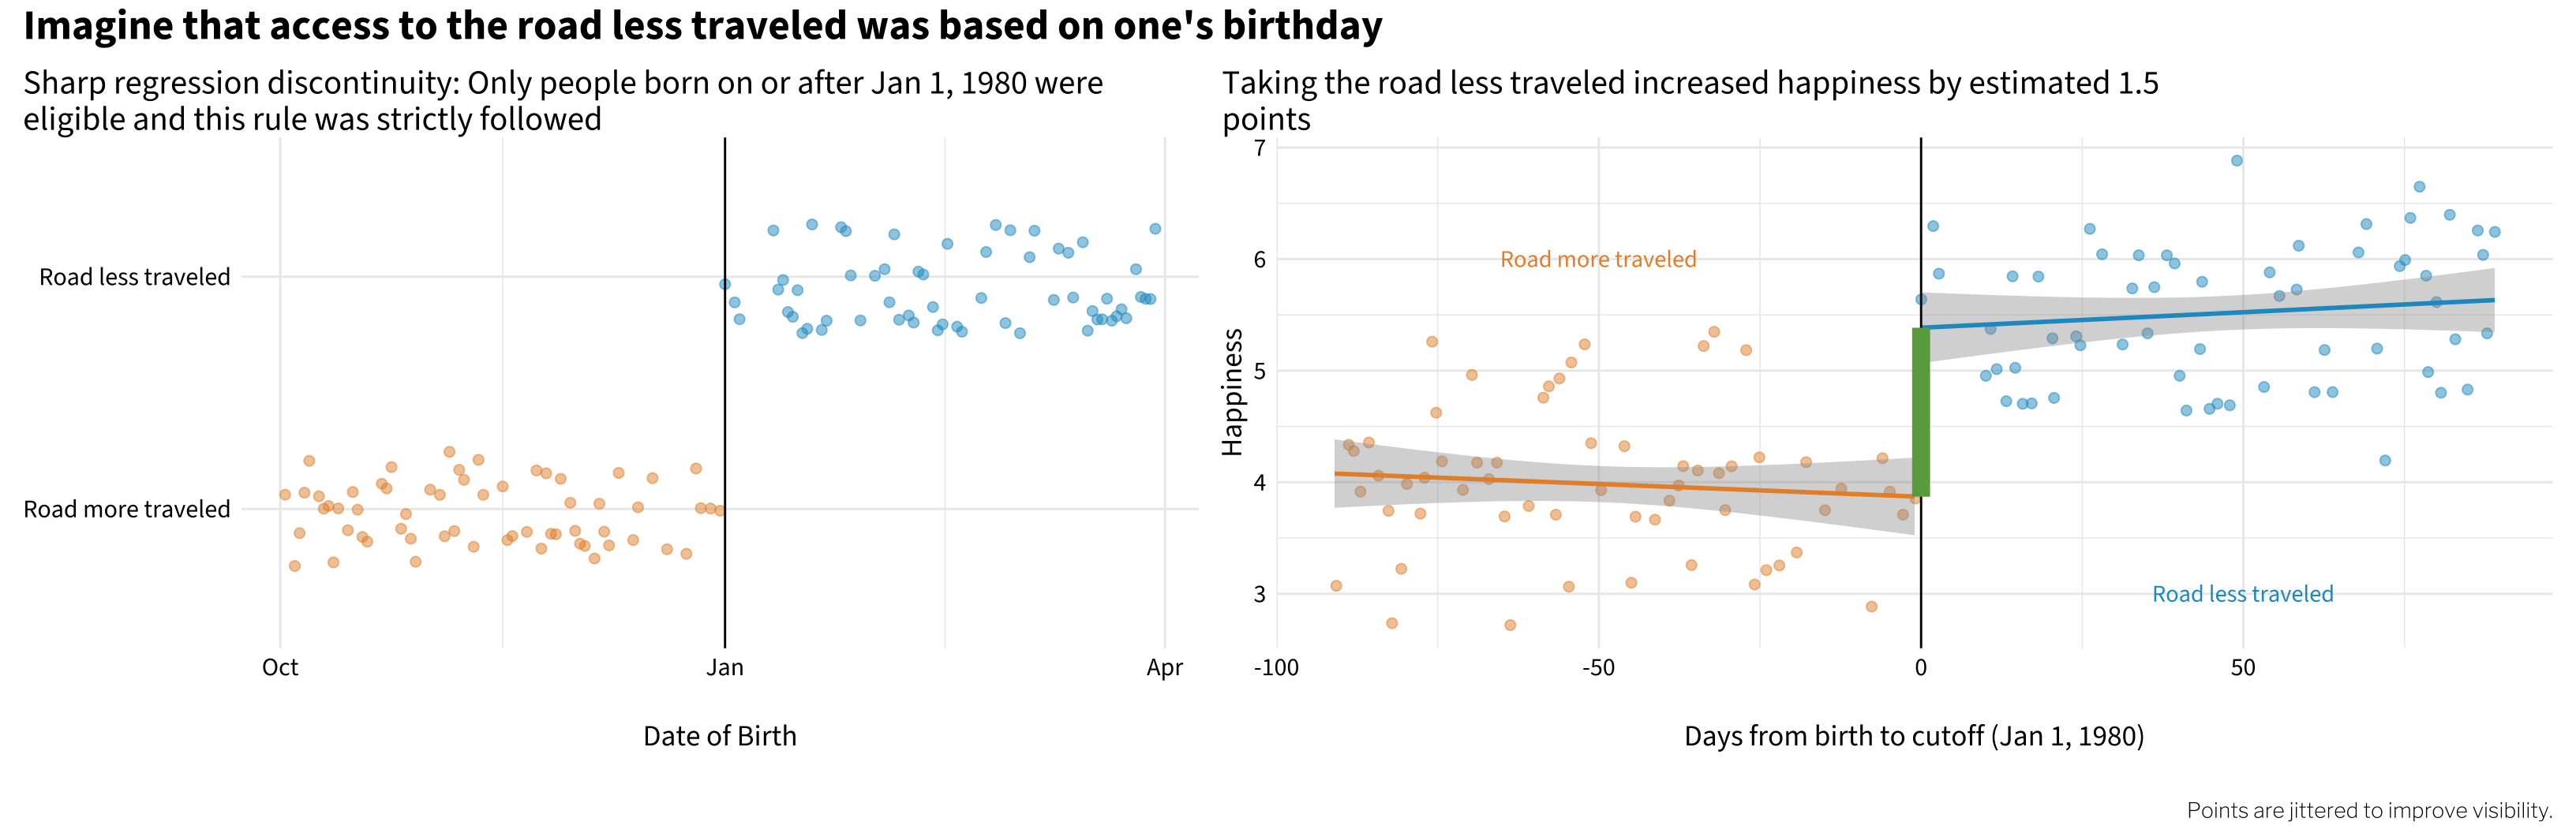
Left panel: which road each person took, by date of birth. Only people born on or after January 1, 1980 were eligible for the road less traveled. Reproduced from Chapter 7.
Slide 8
The jump at the threshold is the estimate
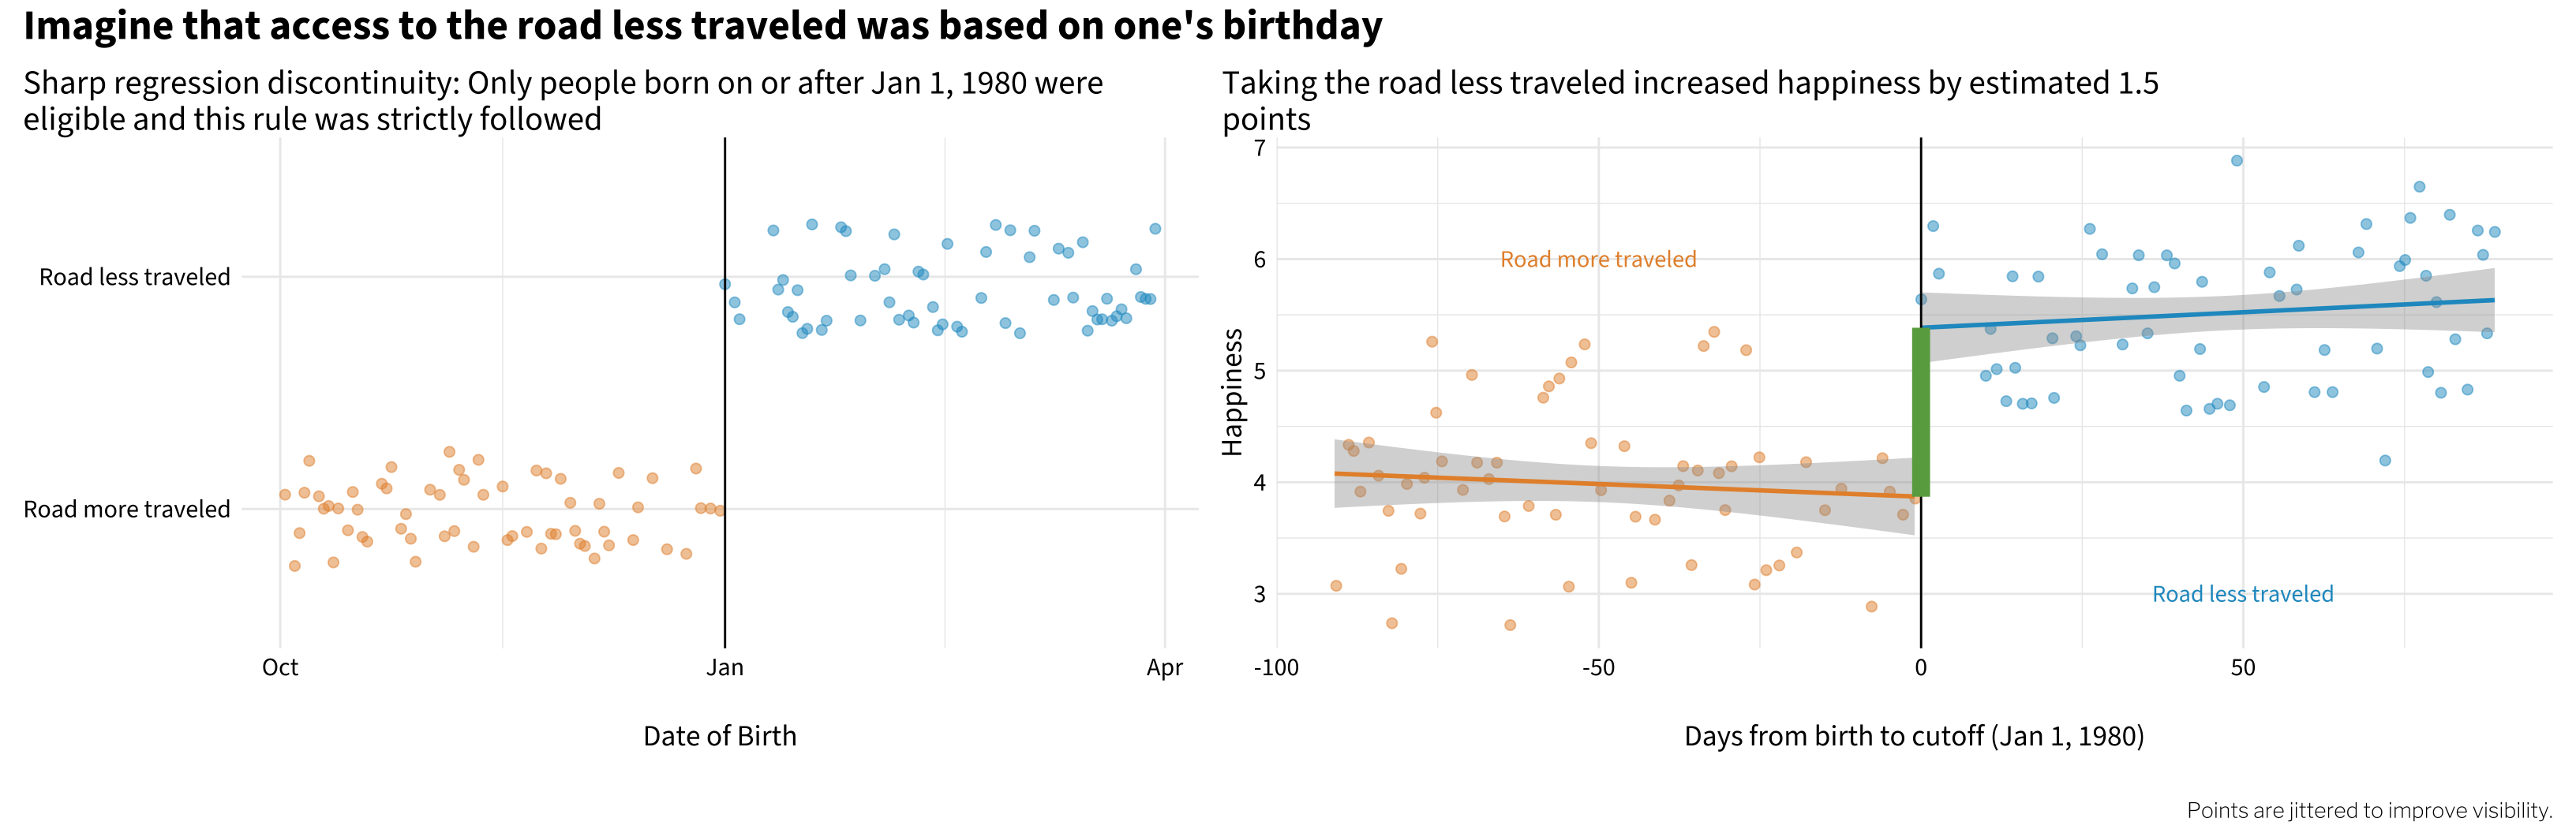
Right panel: happiness by days from birth to the cutoff. The vertical gap at the threshold is the estimated effect. Reproduced from Chapter 7.
Slide 9
People on either side of midnight are otherwise the same
Similar in many observable and unobservable ways
The only difference is that one group wasn't allowed to take the road
Which isolates the front door from `road_traveled` to `happiness`
Slide 10
Matthay et al., 2020
The instrument changes exposure, and nothing else
It must have no other mechanism of impacting the outcome
Instrumental variables, difference-in-differences, interrupted time series
All of them come later in the book
Slide 11
Does HPV vaccination lead to riskier sexual behavior?
Critics worried the vaccine might cause "sexual disinhibition"
That vaccinated girls might feel protected and take more risk
The concern affected uptake and shaped public health debates worldwide
Slide 12
The groups we want to compare differ in ways that matter
Health beliefs and parental attitudes shape whether a girl is vaccinated
They also shape conversations, monitoring, and baseline risk profiles
Backdoor paths bias the comparison even if the vaccine does nothing
Slide 13
Randomized trials tested efficacy and safety
They weren't designed, powered, or structured for downstream sexual behavior
So the behavioral question went to observational and quasi-experimental designs
Slide 14
A simplified DAG for the HPV question
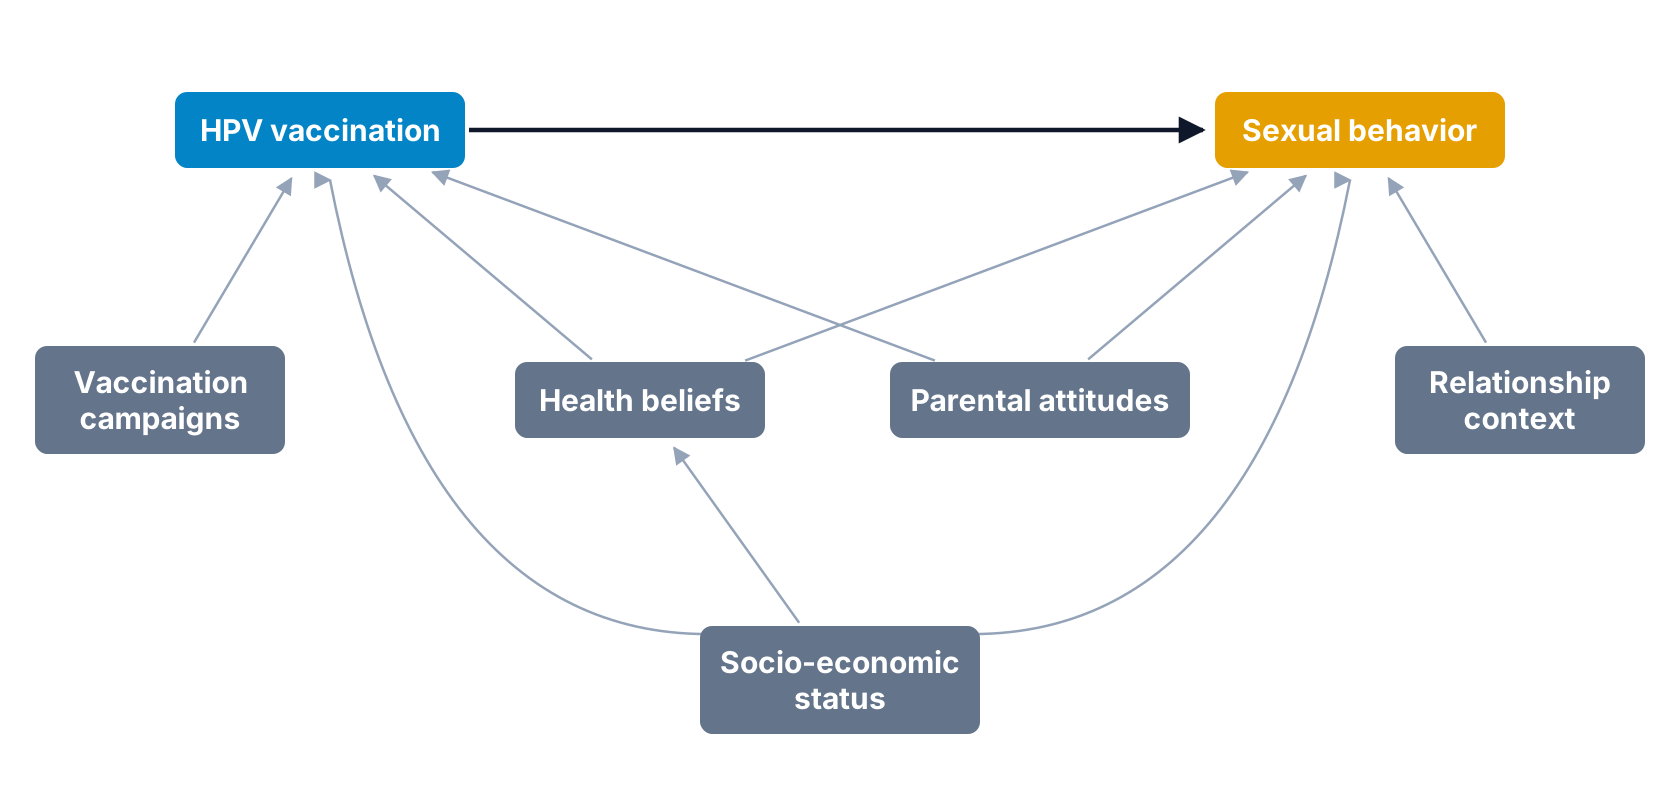
The arrow from HPV vaccination to sexual behavior is the effect we want to estimate. Health beliefs, parental attitudes, and socio-economic status open backdoor paths. Redrawn from Chapter 7.
Slide 15
Smith et al., 2015
Ontario's Grade 8 program, and a birth date cutoff
Publicly funded HPV vaccination for girls in Grade 8, introduced in 2007
Born on or after January 1, 1994 — eligible
Born December 31, 1993 or earlier — not eligible
Slide 16
Smith et al., 2015
The design itself handled the confounding problem
Girls born one day apart are essentially identical
The only systematic difference is program eligibility
No need to measure all those hard-to-observe confounders
Slide 17
Smith et al., 2015
No evidence that vaccination increased risky sexual behavior
No significant effect on pregnancy rates or sexually transmitted infections
The estimate applies locally, near the eligibility cutoff
And relies on assumptions about smoothness around the threshold
Slide 18
If you can run a trial, run a trial
Randomizing destroys confounding by design — and no DAG is required
But we can't randomize adolescents to a vaccine, or people to coffee
Ethical, logistical, and financial constraints rule out many questions
Slide 19
We opened in causal deniability
Warn that correlation is not causation, then recommend anyway
We make causal claims every time we recommend a policy or counsel a patient
So we need to do the work
Slide 20
The DAG told them what they were up against
It revealed backdoor paths that statistical adjustment could not close
That clarity pointed toward a design-based solution
It did not tell them which method to use
Slide 21
The tools in this chapter · 1 of 2
Make the causal model explicit
*Define causes and effects precisely.* What exactly are we claiming changes what?
*Think in potential outcomes.* What would happen under different scenarios?
*Draw your assumptions.* Use DAGs to make your causal model explicit.
Slide 22
The tools in this chapter · 2 of 2
Then act on what it tells you
*Identify what to adjust for.* Close backdoor paths, but don't condition on colliders.
*Know when to look for a design.* Unmeasurable confounders call for a clever design.
Slide 23
In Closing
Causal inference from observational data is hard
The assumptions are strong, and you can never definitively prove they hold
That is a reason to be rigorous, not a reason to retreat
State what you're assuming, probe it, and interpret your findings honestly
Instrument-based approaches
Slide 1If confounder-control is about closing backdoors through statistical adjustment, instrument-based approaches are about isolating front doors. These approaches are sometimes called quasi-experimental designs, because they attempt to mimic the beauty and logic of a perfectly conducted randomized controlled trial.
Experiments close every backdoor
Observational DAG versus experimental DAG. Under randomization, the only arrow into road traveled is randomization itself. Reproduced from Chapter 7.
Slide 2Randomized controlled trials are effective because they close all backdoors that run from the proposed cause to the outcome. For instance, if we were somehow able to randomly assign people to the road less traveled or the road more traveled, and if people complied with these assignments, then the only arrow into road traveled would be randomization. Randomization would be the only cause of road traveled.
Randomization destroys confounding
Including confounding from variables you thought to measure, like `cognition`
And from variables you can't or don't measure, for whatever reason
Which is why experiments get called the gold standard
Slide 3Randomization destroys confounding. That includes confounding from variables you think to measure, like cognition in our example, as well as variables that you can't or don't measure, for whatever reason. This idea is so powerful that many people refer to experiments as the gold standard when it comes to causal inference. A lot can go wrong with experiments that can dull their shine, and we'll get to examples later.
Look for a partial cause of the exposure, unrelated to the outcome
When randomization is not possible, confounding is likely
Confounder-control accounts for it statistically
An exogenous source of variation can identify the effect instead
Slide 4When randomization is not possible, confounding is likely. You can try to account for that confounding statistically, which is confounder-control, or you can search for partial causes of the exposure that are unrelated to the outcome. Sometimes you can get lucky and find an exogenous source of variation in the exposure and use it to identify the causal effect.
Suppose access to the road turned on your birthdate
Born on or after January 1, 1980 — you may pass
Born December 31, 1979 — take the road more traveled
The basic setup for a regression discontinuity design
Slide 5For instance, imagine that we couldn't randomize who travels which road, but we could restrict access to the road less traveled to people born on or after January first, nineteen eighty. Someone born on January first, nineteen eighty would be allowed to pass, but someone born on December thirty-first, nineteen seventy-nine would have to take the road more traveled. This is the basic setup for a regression discontinuity design, which fits in the instrument-based, or quasi-experimental, bucket.
The instrument sits upstream of the exposure
Regression discontinuity DAG. Reproduced from Chapter 7.
Slide 6Here is that design as a DAG. Birthdate on or after January first, nineteen eighty is an instrument that causes exogenous variation in who is exposed to the road less traveled.
A sharp cutoff, and the rule was strictly followed
Left panel: which road each person took, by date of birth. Only people born on or after January 1, 1980 were eligible for the road less traveled. Reproduced from Chapter 7.
Slide 7You can see the instrument working in the left panel. Access is sharp: only people born on or after the cutoff took the road less traveled, and this rule was strictly followed. That variation is almost as good as randomization, because the cutoff is arbitrary.
The jump at the threshold is the estimate
Right panel: happiness by days from birth to the cutoff. The vertical gap at the threshold is the estimated effect. Reproduced from Chapter 7.
Slide 8The right panel narrows to people born right around the cutoff and compares their happiness. When we limit our investigation to people born right around this arbitrary cutoff, any potential link between birthdate and the outcome is broken. The vertical jump at the threshold is the estimated effect, an estimated one point five points of happiness.
People on either side of midnight are otherwise the same
Similar in many observable and unobservable ways
The only difference is that one group wasn't allowed to take the road
Which isolates the front door from `road_traveled` to `happiness`
Slide 9We'd argue that people born just before and just after the cutoff are similar in many observable and unobservable ways. The only difference is that people born before the cutoff weren't allowed to take the road less traveled. That isolates the front door from road traveled to happiness.
Matthay et al., 2020
The instrument changes exposure, and nothing else
It must have no other mechanism of impacting the outcome
Instrumental variables, difference-in-differences, interrupted time series
All of them come later in the book
Slide 10The key to this design, and others in this category, is that the instrument changes the probability of exposure without having any other mechanism of impacting the outcome. Later in the book you'll see examples of regression discontinuity in practice, along with other quasi-experimental designs like instrumental variables, difference-in-differences, and interrupted time series.
Does HPV vaccination lead to riskier sexual behavior?
Critics worried the vaccine might cause "sexual disinhibition"
That vaccinated girls might feel protected and take more risk
The concern affected uptake and shaped public health debates worldwide
Slide 11Up to this point, we've used simple examples, roads and travelers and happiness, to illustrate what causal questions are, how counterfactuals work, and how DAGs help us reason about causation. To close this chapter, let's apply those ideas to a real question from public health research. Does HPV vaccination lead to riskier sexual behavior? When the human papillomavirus vaccine was introduced, critics worried it might cause sexual disinhibition, that vaccinated girls might feel protected against sexually transmitted infections and therefore engage in riskier behavior. Researchers wanted to know: does getting vaccinated actually change behavior?
The groups we want to compare differ in ways that matter
Health beliefs and parental attitudes shape whether a girl is vaccinated
They also shape conversations, monitoring, and baseline risk profiles
Backdoor paths bias the comparison even if the vaccine does nothing
Slide 12The first instinct is to compare outcomes, like pregnancy rates or S T I diagnoses, between vaccinated and unvaccinated girls. But this comparison is misleading. Girls who get vaccinated differ systematically from those who don't. The same health beliefs and parental attitudes that lead a family to vaccinate their daughter may also lead to different conversations about sexual health, different monitoring of behavior, and different baseline risk profiles. These factors affect both exposure and outcome, creating backdoor paths that bias a naive comparison, even if the vaccine itself has no effect. This is the core problem of confounding: the groups we want to compare differ in ways that matter.
Randomized trials tested efficacy and safety
They weren't designed, powered, or structured for downstream sexual behavior
So the behavioral question went to observational and quasi-experimental designs
Slide 13It is worth noting that HPV vaccines have been evaluated in randomized trials for their biological efficacy and safety. Those trials were not designed to study downstream sexual behavior, nor were they typically powered or structured to do so. As a result, questions about behavioral responses to vaccination have largely been addressed using observational and quasi-experimental designs.
A simplified DAG for the HPV question
The arrow from HPV vaccination to sexual behavior is the effect we want to estimate. Health beliefs, parental attitudes, and socio-economic status open backdoor paths. Redrawn from Chapter 7.
Slide 14To see what confounder control would require, we can draw a DAG. This is a simplified causal diagram for the problem. The arrow from HPV vaccination to sexual behavior represents the causal effect we want to estimate. To estimate that effect, we need to close several backdoor paths. Can you identify them?
Smith et al., 2015
Ontario's Grade 8 program, and a birth date cutoff
Publicly funded HPV vaccination for girls in Grade 8, introduced in 2007
Born on or after January 1, 1994 — eligible
Born December 31, 1993 or earlier — not eligible
Slide 15Researchers studying this question in Ontario found a clever way around the confounding problem. In two thousand seven, Ontario introduced a publicly funded HPV vaccination program for girls in grade eight. Eligibility was determined by birth date. Girls born on or after January first, nineteen ninety-four were eligible. Girls born December thirty-first, nineteen ninety-three or earlier were not.
Smith et al., 2015
The design itself handled the confounding problem
Girls born one day apart are essentially identical
The only systematic difference is program eligibility
No need to measure all those hard-to-observe confounders
Slide 16That arbitrary cutoff created something close to random assignment. Girls born one day apart, December thirty-first versus January first, are essentially identical in their health beliefs, parental attitudes, and socioeconomic circumstances. The only systematic difference is program eligibility, which dramatically affected vaccination rates. By comparing outcomes just above and just below this cutoff, researchers could estimate the effect of vaccination without needing to measure all those hard-to-observe confounders. The design itself handled the confounding problem.
Smith et al., 2015
No evidence that vaccination increased risky sexual behavior
No significant effect on pregnancy rates or sexually transmitted infections
The estimate applies locally, near the eligibility cutoff
And relies on assumptions about smoothness around the threshold
Slide 17The result? No evidence that HPV vaccination increased risky sexual behavior. The study found no significant effect on pregnancy rates or sexually transmitted infections among vaccinated girls. As with all regression discontinuity designs, this estimate applies locally, near the eligibility cutoff, and relies on assumptions about smoothness around the threshold.
If you can run a trial, run a trial
Randomizing destroys confounding by design — and no DAG is required
But we can't randomize adolescents to a vaccine, or people to coffee
Ethical, logistical, and financial constraints rule out many questions
Slide 18Randomized controlled trials are the gold standard for causal inference. When you can randomize, you destroy confounding by design. No unmeasured variables can bias your estimate, and no DAG is required. Causal claims from well-conducted trials have the strongest internal validity. If you can run a trial, run a trial. But you can't always run a trial. We can't randomize adolescents to receive the HPV vaccine to study behavioral effects. We can't randomize people to drink coffee for decades. We can't randomize children to malnutrition. Ethical, logistical, and financial constraints put many of our most important questions out of experimental reach.
We opened in causal deniability
Warn that correlation is not causation, then recommend anyway
We make causal claims every time we recommend a policy or counsel a patient
So we need to do the work
Slide 19This chapter is about what to do when randomization isn't possible. We opened with a coffee study that fell into the causal deniability trap: warn that correlation is not causation, then make health recommendations anyway. That's not good enough. If we're going to make causal claims, and we are, every time we recommend a policy or counsel a patient, we need to do the work.
The DAG told them what they were up against
It revealed backdoor paths that statistical adjustment could not close
That clarity pointed toward a design-based solution
It did not tell them which method to use
Slide 20We closed with an HPV study that shows what that work looks like. Drawing a DAG revealed the confounding problem: health beliefs and parental attitudes create backdoor paths that would be nearly impossible to close with statistical adjustment. That clarity pointed toward a design-based solution, exploiting an arbitrary birthday cutoff to approximate random assignment. The DAG didn't tell the researchers which method to use. It told them what they were up against, and that's exactly what you need to know before choosing your approach.
The tools in this chapter · 1 of 2
Make the causal model explicit
*Define causes and effects precisely.* What exactly are we claiming changes what?
*Think in potential outcomes.* What would happen under different scenarios?
*Draw your assumptions.* Use DAGs to make your causal model explicit.
Slide 21The tools in this chapter make that kind of reasoning possible. Define causes and effects precisely: what exactly are we claiming changes what? Think in potential outcomes: what would happen under different scenarios? And draw your assumptions, using DAGs to make your causal model explicit.
The tools in this chapter · 2 of 2
Then act on what it tells you
*Identify what to adjust for.* Close backdoor paths, but don't condition on colliders.
*Know when to look for a design.* Unmeasurable confounders call for a clever design.
Slide 22Then identify what to adjust for. Close backdoor paths, but don't condition on colliders. And know when to look for a design: if the DAG reveals unmeasurable confounders, a clever design may be your best path forward.
In Closing
Causal inference from observational data is hard
The assumptions are strong, and you can never definitively prove they hold
That is a reason to be rigorous, not a reason to retreat
State what you're assuming, probe it, and interpret your findings honestly
Slide 23Causal inference from observational data is hard. The assumptions are strong, and while you can probe them, you can never definitively prove they hold. But that's not a reason to retreat into causal deniability. It's a reason to be rigorous. To state what we're assuming, to probe those assumptions, and to interpret our findings honestly. That's not a limitation. That's science.