Chapter 11 · Video 6
Instrumental variables, and choosing a design
Print layout
Slide 1


Instrumental variables, and choosing a design
Slide 2
Education and health share confounders we can't measure
Cognitive ability, supportive families, baseline health, motivation
These factors affect both education and health
Slide 3
What does an instrument have to do?
Affect treatment
Affect the outcome only through its effect on treatment
Example: raising the school-leaving age from 14 to 16
Slide 4
Comparing outcomes when the instrument pushes more people toward treatment
The outcome difference, scaled by the shift in treatment uptake
The effect only for the people the instrument moved
A back door from the instrument to the outcome breaks the design
Slide 5
Encouragement designs
What an encouragement design randomizes
An invitation, a subsidy, or a home visit
The randomized encouragement is the instrument for actual treatment
Slide 6
Instrumental variables
Randomized encouragement as an instrument
Instrumental variables design. Reproduced from Chapter 11.
Slide 7
Four kinds of people under two-sided noncompliance
Compliers: take treatment when encouraged and don't when not
Always-takers: take treatment regardless
Never-takers: refuse regardless
Defiers: do the opposite of their assignment
Slide 8
Monotonicity
The instrument must push everyone in the same direction
With defiers, the estimate is an uninterpretable weighted average
Usually reasonable, but worth scrutiny when it could cut both ways
Slide 9
Is the effect among compliers the one we need?
LATE: the local average treatment effect
Expanding a voluntary program: the compliers are the people it would reach
Treating everyone: it says nothing about always-takers or never-takers
Slide 10
Tangiers, Morocco
Piped water in low-income neighborhoods
Roughly 845 households without a private connection
Interest-free credit, but only about 10% applied on their own
Authorization, photocopies of ID and a down payment at a branch office
Slide 11
Devoto et al., 2012
A randomized door-to-door campaign
Encouraged (434)
Paperwork handled on the spot
69% connected by six months
Control (411)
Eligible for the same credit
10% connected by six months
Slide 12
Devoto et al., 2012
Did piped water improve child health?
No reduction in waterborne disease
Households already had clean water from public taps
Slide 13
Devoto et al., 2012
Where the gains in well-being came from
Households carrying water spent over seven hours a week fetching it
That time went to leisure and socializing
Less conflict with neighbors, higher life satisfaction
Slide 14
What makes this a strong instrument
A first-stage difference of 59 percentage points
Exclusion: the campaign gave only help with paperwork
Balance at baseline across 57 characteristics
Slide 15
Who the compliers are in this study
Households who would connect with help, but not on their own
The people a simplified application process would reach
Slide 16
Choosing a design · 1 of 2
Six designs, their key assumptions and main threats
Pre-post: nothing else changed · history, maturation
Post-only: groups comparable · selection bias
Difference-in-differences: parallel trends · differential trends, spillovers
Slide 17
Choosing a design · 2 of 2
Six designs, their key assumptions and main threats
Interrupted time series: trend would have continued · concurrent events
Regression discontinuity: no sorting at cutoff · manipulation, bundled treatments
Instrumental variables: exclusion restriction · weak or invalid instruments
Slide 18
Is randomization possible?
Stepped-wedge designs
Encouragement randomization
Phased rollouts with waitlist controls
Slide 19
In Closing
What would have happened without the intervention?
The answer is the counterfactual
The design is the argument for why that answer is credible
Instrumental variables, and choosing a design
Slide 1Instrumental variables are the last of the six designs in this chapter. After the Tangiers water study, we'll put all six side by side.
Education and health share confounders we can't measure
Cognitive ability, supportive families, baseline health, motivation
These factors affect both education and health
Slide 2Consider trying to estimate the effect of education on health. People who get more education are different from those who don't. They might have higher cognitive ability, more supportive families, better health to begin with, or greater motivation, and these factors affect both education and health. Even with rich data, we probably can't measure all these confounders.
What does an instrument have to do?
Affect treatment
Affect the outcome only through its effect on treatment
Example: raising the school-leaving age from 14 to 16
Slide 3Instrumental variables offer a solution: find something that affects treatment but affects the outcome only through its effect on treatment. In the education example, researchers have used changes in compulsory schooling laws as an instrument. When a country raises the minimum school-leaving age from 14 to 16, some people get more education than they otherwise would have because the law changed, and not because of their motivation or family background. If the law affects health only by changing how long people stay in school, the variation it creates is the clean variation this design needs.
Comparing outcomes when the instrument pushes more people toward treatment
The outcome difference, scaled by the shift in treatment uptake
The effect only for the people the instrument moved
A back door from the instrument to the outcome breaks the design
Slide 4The counterfactual here compares what happens when the instrument pushes more people toward treatment with what happens when it pushes fewer. The outcome difference between instrument groups, scaled by how much the instrument shifts treatment uptake, reveals the causal effect, but only for the people the instrument actually moved, the compliers. The key assumption is that the instrument affects the outcome only by changing treatment. If the instrument has a back door to the outcome, the whole strategy collapses.
Encouragement designs
What an encouragement design randomizes
An invitation, a subsidy, or a home visit
The randomized encouragement is the instrument for actual treatment
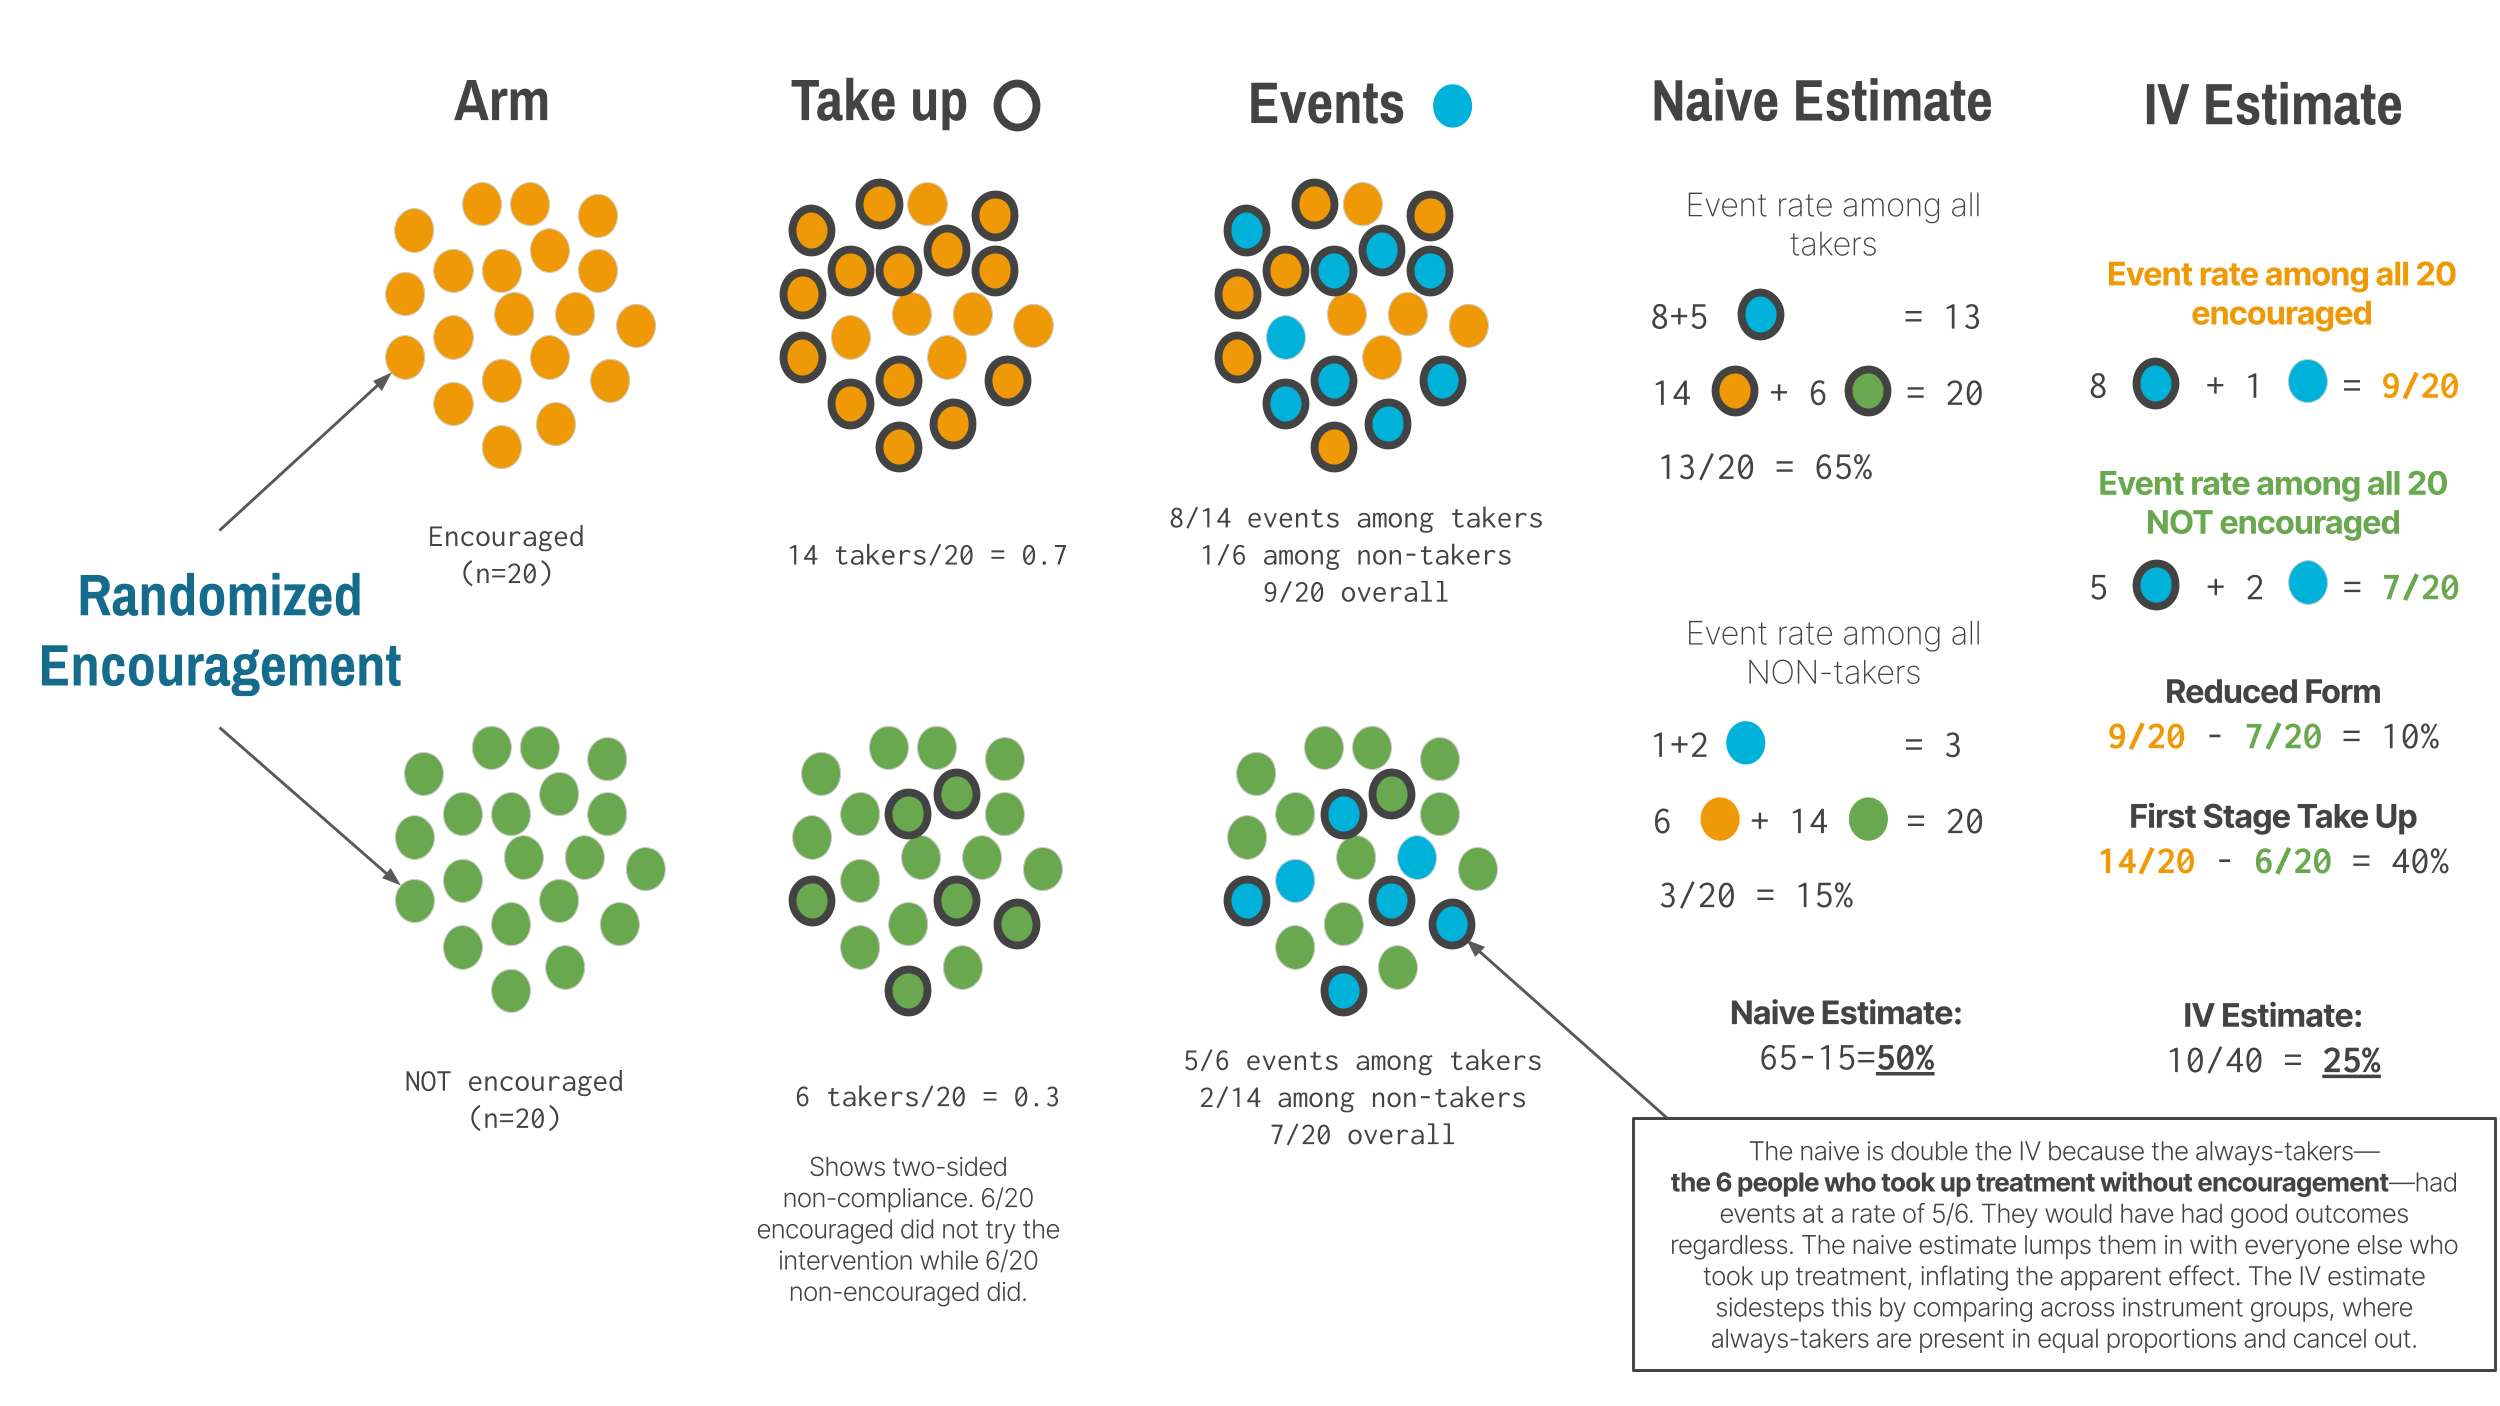
Slide 5In a standard randomized trial, we randomize treatment assignment and hope everyone complies. In practice, compliance is rarely perfect. Some people assigned to treatment don't take it up, and some people assigned to control find a way to get treated anyway. An encouragement design embraces this reality. We randomize encouragement, like an invitation, a subsidy, or a home visit, and use the randomized encouragement as an instrument for actual treatment.
Instrumental variables
Randomized encouragement as an instrument
Instrumental variables design. Reproduced from Chapter 11.
Slide 6This is instrumental variables with a randomized instrument. Randomization guarantees exchangeability and makes the exclusion restriction more defensible, though not automatic. The encouragement must affect the outcome only through its effect on treatment uptake. A home visit that encourages vaccination but also provides health education affects health through two channels, and that violates exclusion.
Four kinds of people under two-sided noncompliance
Compliers: take treatment when encouraged and don't when not
Always-takers: take treatment regardless
Never-takers: refuse regardless
Defiers: do the opposite of their assignment
Slide 7In many trials, noncompliance runs in both directions, which creates four types of people. Compliers take treatment when encouraged and don't when not. Always-takers take treatment regardless, never-takers refuse regardless, and defiers do the opposite of their assignment. The always-takers and never-takers provide no information about the effect of treatment, because the instrument didn't change their behavior. That's why the design estimates a local average treatment effect: the effect among the people the instrument actually moved.
Monotonicity
The instrument must push everyone in the same direction
With defiers, the estimate is an uninterpretable weighted average
Usually reasonable, but worth scrutiny when it could cut both ways
Slide 8For that estimate to be interpretable, we need a monotonicity assumption: the instrument must push everyone in the same direction. If encouragement makes some people more likely to take treatment and others less likely, the estimate becomes an uninterpretable weighted average. In most settings, monotonicity is reasonable. It's hard to imagine why being offered help with paperwork would cause some households to avoid connecting to the water system. But where the instrument could plausibly cut both ways, the assumption deserves scrutiny.
Is the effect among compliers the one we need?
LATE: the local average treatment effect
Expanding a voluntary program: the compliers are the people it would reach
Treating everyone: it says nothing about always-takers or never-takers
Slide 9Whether the local average treatment effect is useful depends on the policy question. If we want to know whether to expand a voluntary program, and the instrument is program availability, the effect among compliers is exactly what we need, because they're the people the expansion would reach. If we want to know what would happen if everyone received treatment, it's less helpful, because it says nothing about always-takers or never-takers.
Tangiers, Morocco
Piped water in low-income neighborhoods
Roughly 845 households without a private connection
Interest-free credit, but only about 10% applied on their own
Authorization, photocopies of ID and a down payment at a branch office
Slide 10In the low-income neighborhoods of Tangiers, Morocco, roughly 845 households lacked a private water connection and couldn't afford the fee to get piped water into their homes. Most relied on public taps or bought water from neighbors. The utility company offered interest-free credit to cover the cost, but take-up was low: only about 10% of eligible households applied on their own. The barriers weren't just financial. The application process required obtaining authorization from local authorities, providing photocopies of identification documents, and making a down payment at a branch office.
Devoto et al., 2012
A randomized door-to-door campaign
Encouraged (434)
Paperwork handled on the spot
69% connected by six months
Control (411)
Eligible for the same credit
10% connected by six months
Slide 11A research team designed a randomized encouragement trial. They randomly assigned 434 households to a door-to-door campaign that explained the credit program and handled the paperwork on the spot, while 411 households served as controls, eligible for the same credit but without the individualized assistance. The randomized encouragement is the instrument, and actual connection to piped water is the treatment. By six months, 69% of encouraged households had purchased a connection, compared to 10% of controls.
Devoto et al., 2012
Did piped water improve child health?
No reduction in waterborne disease
Households already had clean water from public taps
Slide 12The results were surprising. Piped water connections did not improve child health. There was no reduction in waterborne disease, which makes sense: these households already had access to clean water through public taps. The water quality didn't change, only the convenience of access.
Devoto et al., 2012
Where the gains in well-being came from
Households carrying water spent over seven hours a week fetching it
That time went to leisure and socializing
Less conflict with neighbors, higher life satisfaction
Slide 13But the connections improved well-being through a different channel. Among households that had been carrying containers to the public tap, about 43% of the sample, the time spent fetching water averaged over seven hours per week, time that a private connection eliminated. That time went to leisure and socializing, and not to labor market participation or schooling. Conflict with neighbors over water access dropped, and life satisfaction increased substantially.
What makes this a strong instrument
A first-stage difference of 59 percentage points
Exclusion: the campaign gave only help with paperwork
Balance at baseline across 57 characteristics
Slide 14The study illustrates several features of good practice. The instrument is strong, with a first-stage difference of 59 percentage points. Exclusion is defensible, because the information campaign provided no health services, no income, and no goods other than help with paperwork. The researchers checked that treatment and control groups were balanced at baseline across 57 characteristics. And the findings challenge the assumption that water infrastructure improvements work primarily through health, an assumption that would have led to the wrong conclusion if the study had measured only waterborne disease.
Who the compliers are in this study
Households who would connect with help, but not on their own
The people a simplified application process would reach
Slide 15The trade-off is that we estimate the effect for compliers only. In this case, the compliers are households who would connect to the water system if someone helped them navigate the bureaucracy but wouldn't do it on their own. That's a policy-relevant group: they're exactly the people a simplified application process would reach.
Choosing a design · 1 of 2
Six designs, their key assumptions and main threats
Pre-post: nothing else changed · history, maturation
Post-only: groups comparable · selection bias
Difference-in-differences: parallel trends · differential trends, spillovers
Slide 16Here are the six designs side by side. Each makes different assumptions about what serves as the counterfactual, and each is vulnerable to different threats. A pre-post design assumes nothing else changed, and its main threats are history and maturation; it's best for exploratory work and formative evaluation. A post-test only comparison assumes the groups were comparable, and selection bias is the main threat; it's best for retrospective evaluation with no baseline data. Difference-in-differences assumes parallel trends, and differential trends and spillovers are the threats.
Choosing a design · 2 of 2
Six designs, their key assumptions and main threats
Interrupted time series: trend would have continued · concurrent events
Regression discontinuity: no sorting at cutoff · manipulation, bundled treatments
Instrumental variables: exclusion restriction · weak or invalid instruments
Slide 17An interrupted time series assumes the trend would have continued, and concurrent events are the threat; it's the design for population-level policies with no comparison group. Regression discontinuity assumes no sorting at the cutoff, and manipulation and bundled treatments are the threats. Instrumental variables rest on the exclusion restriction, and weak or invalid instruments are the threat.
Is randomization possible?
Stepped-wedge designs
Encouragement randomization
Phased rollouts with waitlist controls
Slide 18Before reaching for any of these, we should ask seriously whether randomization is possible. Sometimes what seems infeasible becomes feasible with creativity: stepped-wedge designs, encouragement randomization, or phased rollouts with waitlist controls. Randomization eliminates the assumptions this entire chapter is about. When it's truly off the table, the choice among quasi-experimental designs depends on what data we have, what structure the setting provides, and which assumptions we can most credibly defend.
In Closing
What would have happened without the intervention?
The answer is the counterfactual
The design is the argument for why that answer is credible
Slide 19John Snow didn't have a name for what he did. He found an accident of infrastructure that created comparison groups nearly as good as randomization, and he used it. Today we have names for these designs, formal assumptions, and statistical machinery to go with them, but the core logic hasn't changed: find variation in treatment that is plausibly unrelated to the outcome, and use it to estimate a causal effect. Parallel trends, exclusion restrictions, and no manipulation at the cutoff are claims about the world that we have to argue for. So when we read or conduct this kind of research, we keep asking the question that ties every design together: what would have happened without the intervention? Our answer is the counterfactual, and our design is the argument for why that answer is credible.