Chapter 14 · Video 3
Mathematical modeling studies
Print layout
Slide 1


Mathematical modeling studies
Slide 2
Zika, 2015 to 2016
Where is the outbreak likely to spread next?
Which countries should prepare for surges in cases?
How many diagnostics would they need?
Countries can't be randomized to receive Zika
Slide 3
Mathematical models
The SEIR model
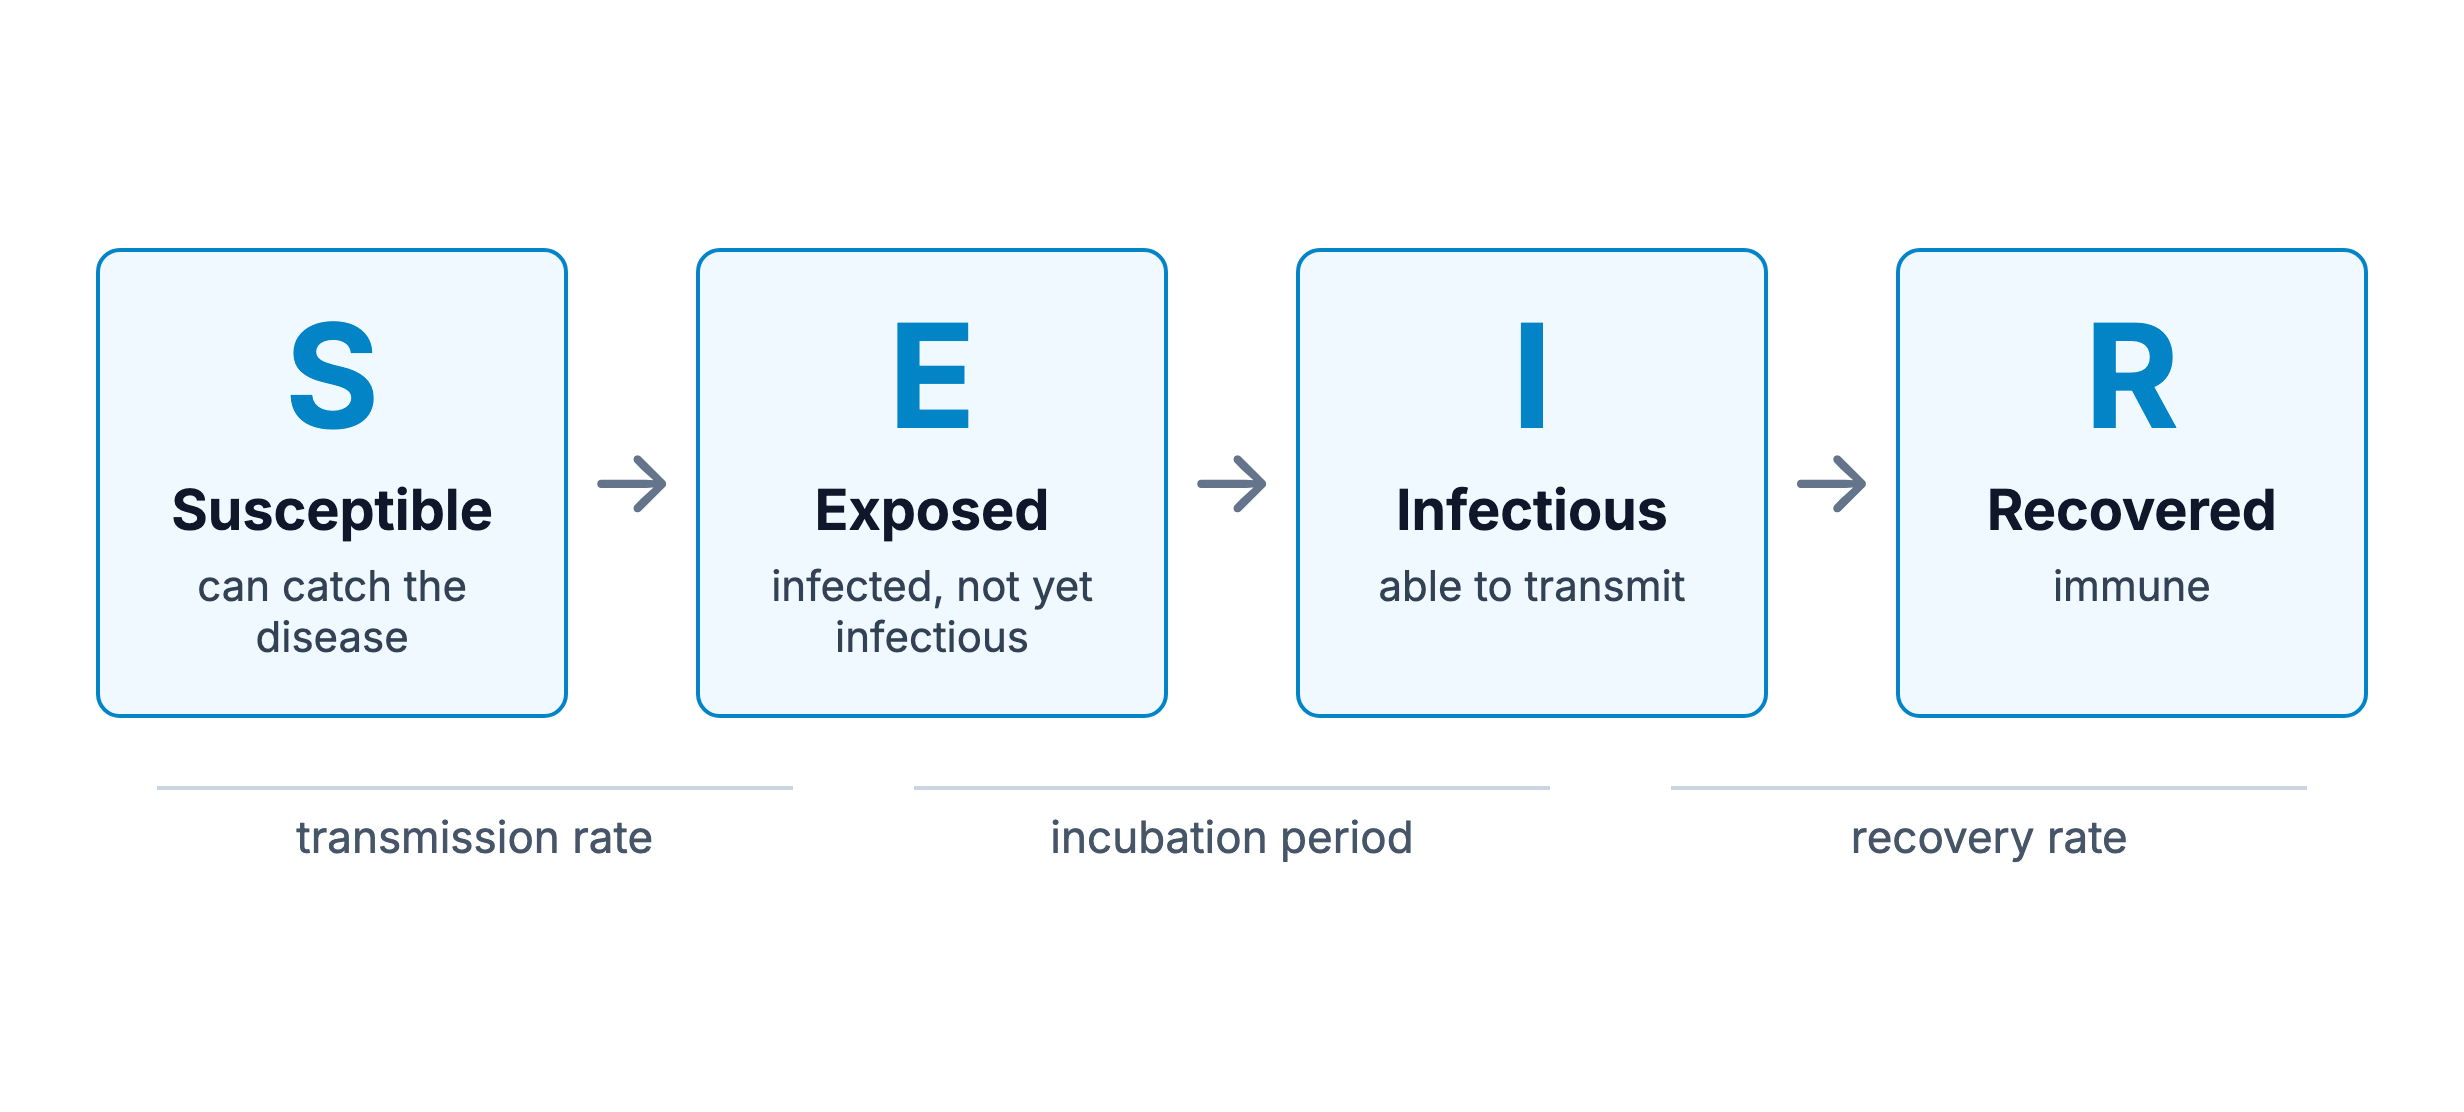
People flow from one compartment to the next based on parameters like the transmission rate, incubation period, and recovery rate.
Slide 4
Akhtar et al., 2019
Forecasting the spread of Zika in real time
Weekly case counts from Pan American Health Organization data
Passenger air travel volumes between countries
Mosquito habitat suitability for Aedes aegypti
Socioeconomic indicators like GDP and population density
Slide 5
Akhtar et al., 2019
How far ahead the Zika model could forecast
The model forecast which countries would become high-risk in the coming weeks
Over 85% accuracy when predicting twelve weeks ahead
Officials could plan resource allocation for the next three months
Slide 6
Mathematical models
Deterministic, stochastic, and agent-based models
Deterministic: the same starting conditions always give identical results
Stochastic: random variation is built in, which is better for capturing uncertainty
Agent-based: individuals follow behavioral rules, and population patterns emerge
Slide 7
Funk et al., 2019
Weekly Ebola forecasts in West Africa
Forecasts for specific regions, published online as new data arrived
They informed real resource allocation decisions
Reliable 1 to 2 weeks ahead, and increasingly unreliable beyond three weeks
Slide 8
Funk et al., 2019
Why the longer forecasts became unreliable
Human behavior changes in response to epidemics
People avoid handshakes, funerals change, clinics adapt protocols
The best models built in dampening mechanisms
Slide 9
Funk et al., 2019
What a dampening mechanism means in practice
A simple SEIR model might predict exponential growth
As an epidemic grows, people respond and transmission slows
Decay terms and uneven contact patterns cut forecast error by about 90%
Slide 10
Funk et al., 2019
Updating and calibrating forecasts as the epidemic unfolds
Use models for near-term operational planning
Update forecasts and recalibrate as new data arrive
Assess how well the uncertainty was quantified, not only the point estimate
Slide 11
Mathematical models
Strengths and limitations of modeling studies
What-if questions that are hard to address experimentally, using many data sources
Outputs are projections under specific assumptions, not predictions of the future
Models that treat human behavior as static overestimate outbreak size
Sensitivity analyses show which parameters drive the results
Mathematical modeling studies
Slide 1Mathematical models use equations to represent how diseases spread through populations, and they're a go-to approach when an experiment can't answer the question.
Zika, 2015 to 2016
Where is the outbreak likely to spread next?
Which countries should prepare for surges in cases?
How many diagnostics would they need?
Countries can't be randomized to receive Zika
Slide 2When the Zika virus started spreading through Latin America in 2015 and 2016, what did public health officials need to know most urgently? Not just where cases existed that day, but where the outbreak was likely to spread next week and next month. Which countries should prepare for surges in cases? How many diagnostics would they need? We can't run an experiment to answer those questions, and by the time we've observed the natural course of events, it's too late to prepare.
Mathematical models
The SEIR model
People flow from one compartment to the next based on parameters like the transmission rate, incubation period, and recovery rate.
Slide 3Think of models as simplified versions of reality that capture the essential dynamics while ignoring unnecessary details. The most common framework is the SEIR model, which divides a population into compartments: susceptible, people who can catch the disease; exposed, infected but not yet infectious; infectious, able to transmit; and recovered, immune. People flow from one compartment to the next based on parameters like the transmission rate, incubation period, and recovery rate. Change those parameters, and we change how the epidemic unfolds.
Akhtar et al., 2019
Forecasting the spread of Zika in real time
Weekly case counts from Pan American Health Organization data
Passenger air travel volumes between countries
Mosquito habitat suitability for Aedes aegypti
Socioeconomic indicators like GDP and population density
Slide 4When Zika hit, researchers built dynamic neural network models that could predict geographic spread in real time. These weren't simple SEIR models. They incorporated weekly case counts from Pan American Health Organization data, passenger air travel volumes between countries, mosquito habitat suitability, and socioeconomic indicators like GDP, population density, and healthcare infrastructure.
Akhtar et al., 2019
How far ahead the Zika model could forecast
The model forecast which countries would become high-risk in the coming weeks
Over 85% accuracy when predicting twelve weeks ahead
Officials could plan resource allocation for the next three months
Slide 5The model took all these data streams, normalized them, and used them to forecast which countries would become high-risk in the coming weeks. Even when predicting twelve weeks ahead, the model achieved over 85% accuracy. That meant officials could plan resource allocation not just for next week, but for the next three months.
Mathematical models
Deterministic, stochastic, and agent-based models
Deterministic: the same starting conditions always give identical results
Stochastic: random variation is built in, which is better for capturing uncertainty
Agent-based: individuals follow behavioral rules, and population patterns emerge
Slide 6Not all models are created equal. In deterministic models, everyone follows the equations exactly, so running the model twice with the same starting conditions gives identical results. That's good for understanding general trends. Stochastic models build in random variation, reflecting the reality that epidemics don't unfold in perfectly predictable ways, and they're better for capturing uncertainty. Agent-based models track individuals instead of populations. Each agent, a person or a mosquito, has its own characteristics and follows behavioral rules, and when thousands of agents interact, population-level patterns emerge.
Funk et al., 2019
Weekly Ebola forecasts in West Africa
Forecasts for specific regions, published online as new data arrived
They informed real resource allocation decisions
Reliable 1 to 2 weeks ahead, and increasingly unreliable beyond three weeks
Slide 7During West Africa's Ebola epidemic, modelers generated weekly forecasts for specific regions, publishing them online as new data arrived, and these forecasts informed real resource allocation decisions. The short-term forecasts, one to two weeks ahead, proved quite reliable, but forecasts beyond three weeks became increasingly unreliable.
Funk et al., 2019
Why the longer forecasts became unreliable
Human behavior changes in response to epidemics
People avoid handshakes, funerals change, clinics adapt protocols
The best models built in dampening mechanisms
Slide 8Why? Because human behavior changes in response to epidemics. People start avoiding handshakes, funerals change, and clinics adapt protocols. The models that worked best incorporated these behavioral changes through dampening mechanisms that constrained how fast case numbers could grow.
Funk et al., 2019
What a dampening mechanism means in practice
A simple SEIR model might predict exponential growth
As an epidemic grows, people respond and transmission slows
Decay terms and uneven contact patterns cut forecast error by about 90%
Slide 9What does a dampening mechanism actually mean in practice? A simple SEIR model might predict exponential growth, where each infected person infects others, who each infect more. But as an epidemic grows, people respond. They change their behavior, clinics improve infection control, and communities modify burial practices, and all of these responses slow transmission. Models that incorporated decay terms, or contact patterns recognizing that not everyone mixes with everyone else equally, reduced forecast error by approximately 90 percent.
Funk et al., 2019
Updating and calibrating forecasts as the epidemic unfolds
Use models for near-term operational planning
Update forecasts and recalibrate as new data arrive
Assess how well the uncertainty was quantified, not only the point estimate
Slide 10The practical implication is to use models for near-term operational planning, and not to expect them to predict the distant future with precision. Update forecasts constantly as new data arrive, and calibrate the model repeatedly as we learn more about how the epidemic is actually unfolding. The Ebola forecasters didn't just assess whether their predictions were close to reality. They used probabilistic calibration assessment to evaluate how well they had quantified uncertainty, because getting the uncertainty bounds right matters as well as the point estimate.
Mathematical models
Strengths and limitations of modeling studies
What-if questions that are hard to address experimentally, using many data sources
Outputs are projections under specific assumptions, not predictions of the future
Models that treat human behavior as static overestimate outbreak size
Sensitivity analyses show which parameters drive the results
Slide 11Models can attempt to answer what-if questions that are hard or impossible to address experimentally, integrate data from multiple sources, and reveal dynamics like tipping points and feedback loops that aren't obvious from empirical data alone. But models are only as good as the assumptions built into them. Their outputs are projections under specific assumptions, not predictions of the future, and uncertainty increases with the forecasting horizon. A model that hasn't been validated against out-of-sample data may be fitting noise, and models that treat human behavior as static will systematically overestimate outbreak size. Always run sensitivity analyses to identify which parameters drive the results and where better data would improve the projections.