Chapter 11 · Video 5
Regression discontinuity and HPV vaccination in Ontario
Print layout
Slide 1


Regression discontinuity
Slide 2
Programs that assign treatment at a threshold
Antiretroviral therapy when a CD4 count falls below a cutoff
Scholarships when test scores exceed a minimum
Subsidies when income falls below a poverty line
Slide 3
Why are people just above and just below a cutoff comparable?
CD4 counts of 495 and 505 differ by a measurement that could have gone the other way
In a narrow window, assignment is effectively arbitrary
Slide 4
Regression discontinuity
A running variable, a cutoff and a discontinuity
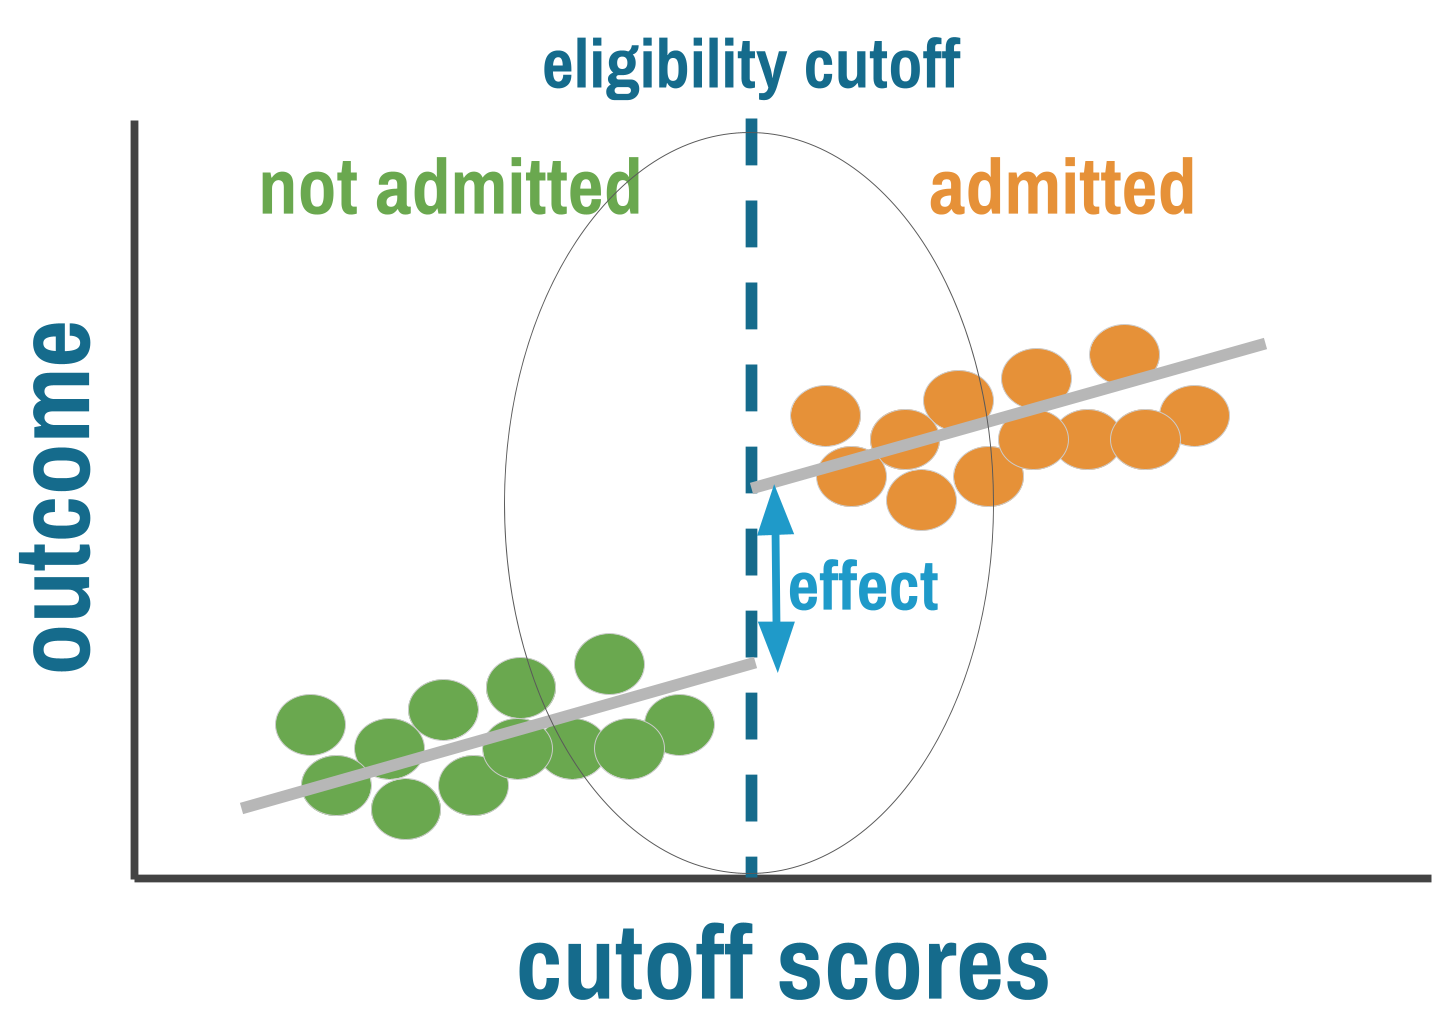
Regression discontinuity design. Reproduced from Chapter 11.
Slide 5
Diagnostics
Sharp and fuzzy designs
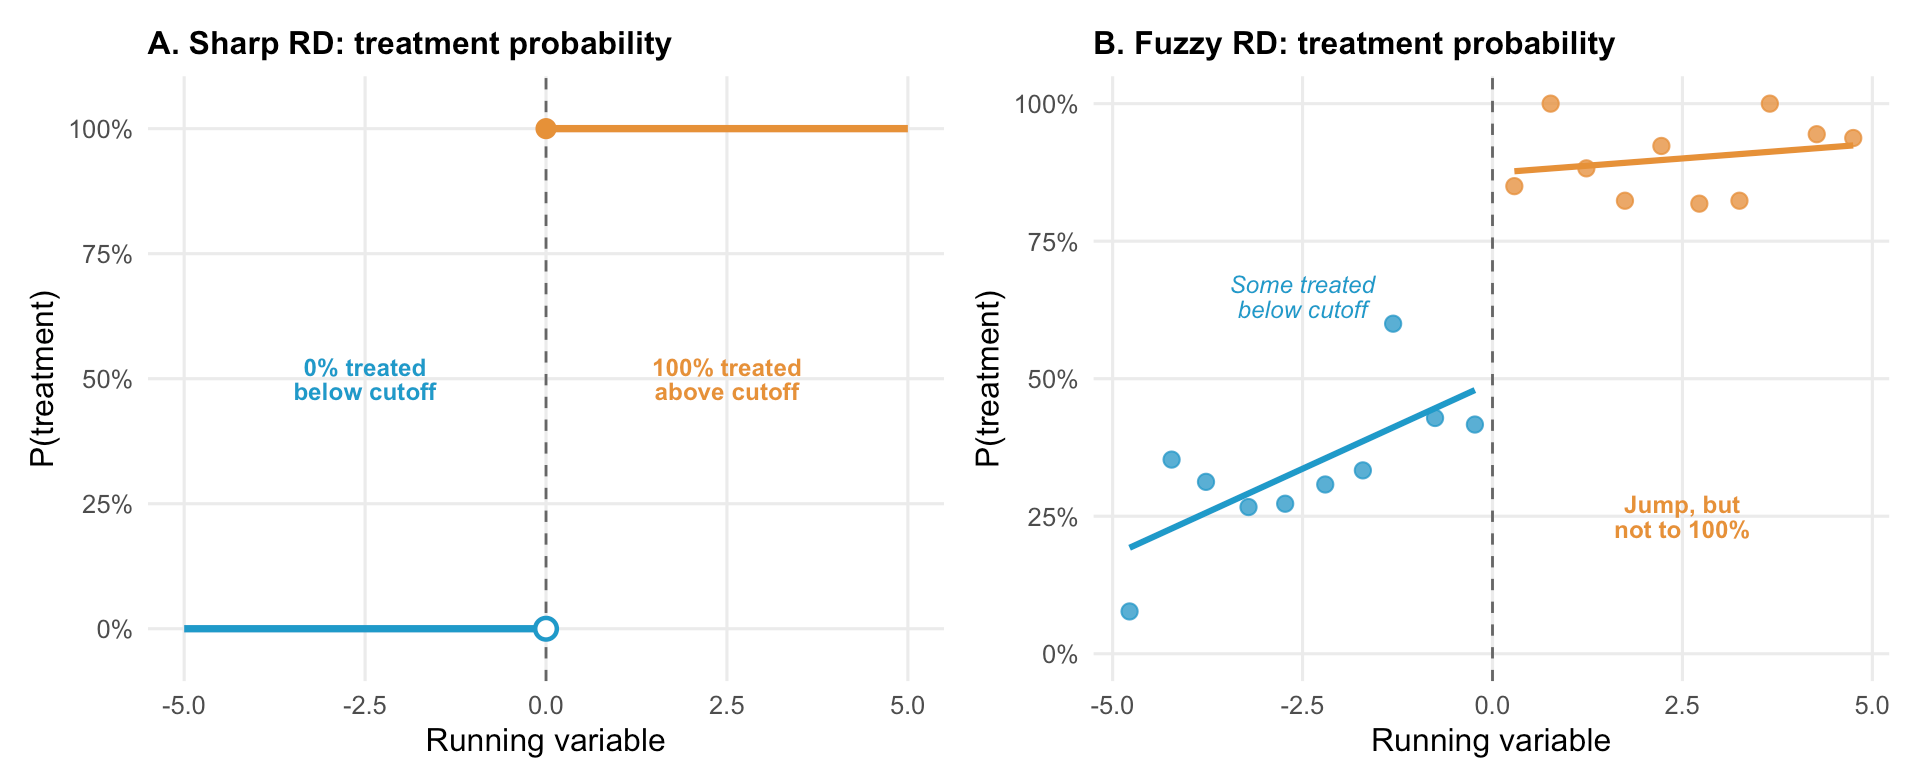
Anatomy of a regression discontinuity design. (A) In a sharp RD, treatment probability jumps from 0 to 1 at the cutoff. (B) In a fuzzy RD, it jumps but not completely. Reproduced from Chapter 11.
Slide 6
Diagnostics
A jump in the outcome at the cutoff
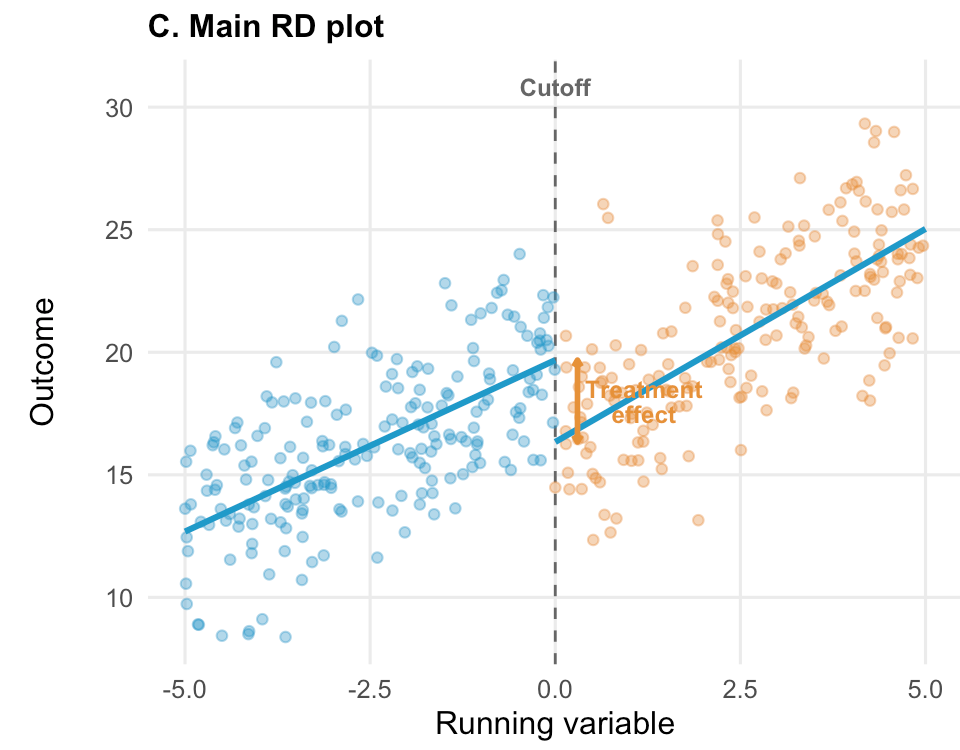
Anatomy of a regression discontinuity design. (C) The main RD plot shows a clear jump in the outcome at the cutoff. Reproduced from Chapter 11.
Slide 7
Diagnostics
The density plot is a check for manipulation
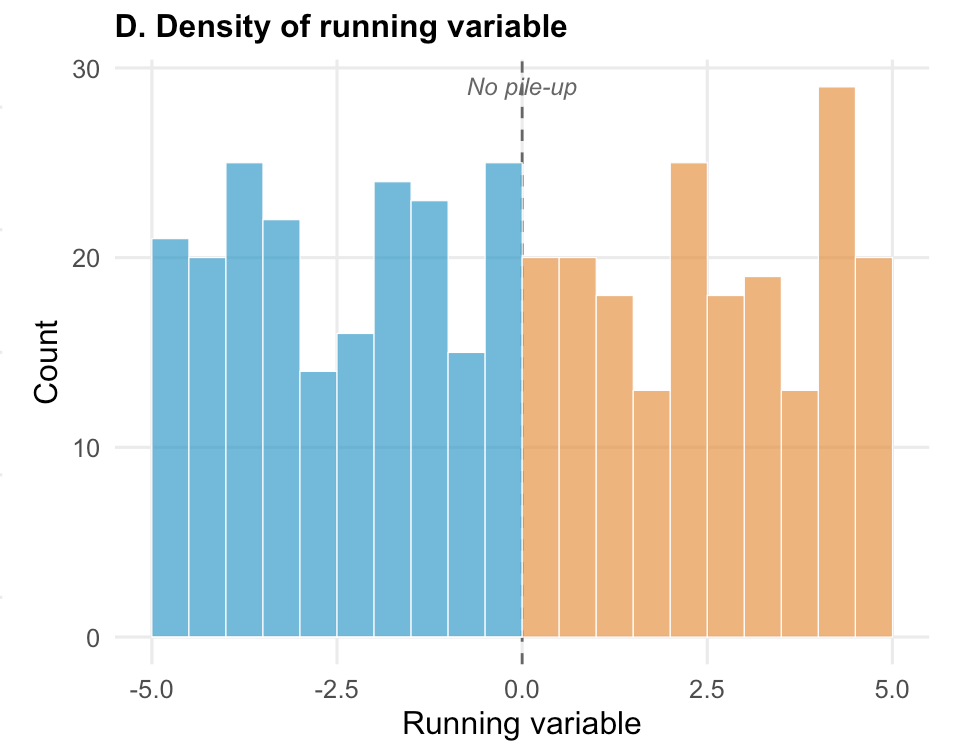
Anatomy of a regression discontinuity design. (D) The density of the running variable is smooth, with no pile-up suggesting manipulation. Reproduced from Chapter 11.
Slide 8
Diagnostics
Placebo cutoffs
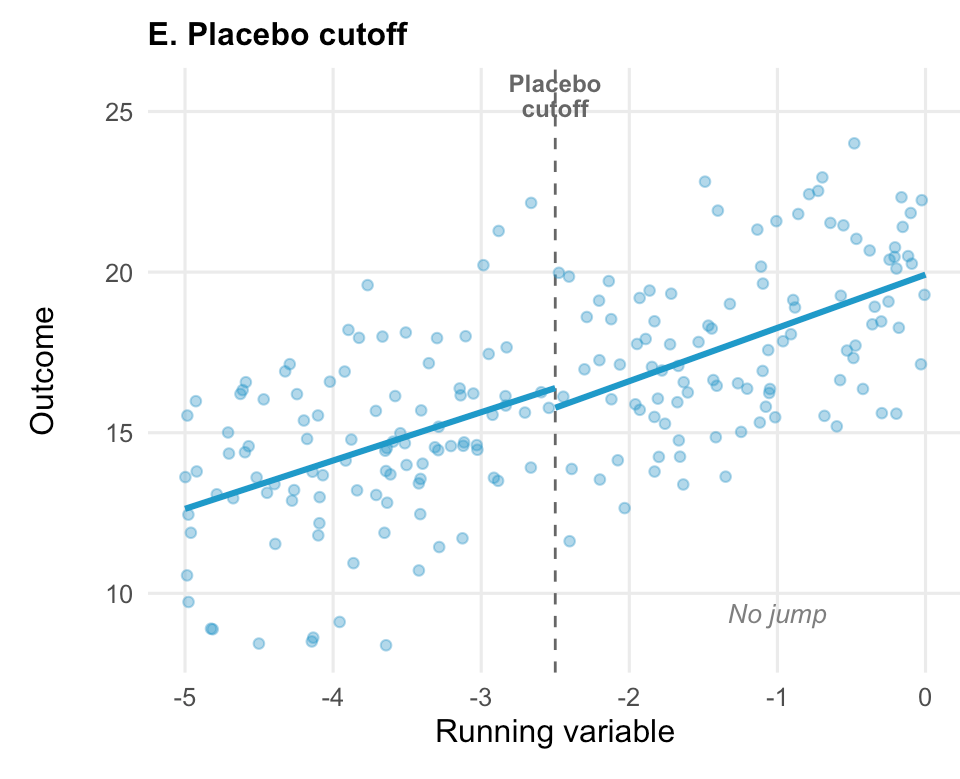
Anatomy of a regression discontinuity design. (E) A placebo cutoff shows no jump where none should exist. Reproduced from Chapter 11.
Slide 9
Diagnostics
Covariate balance across the cutoff
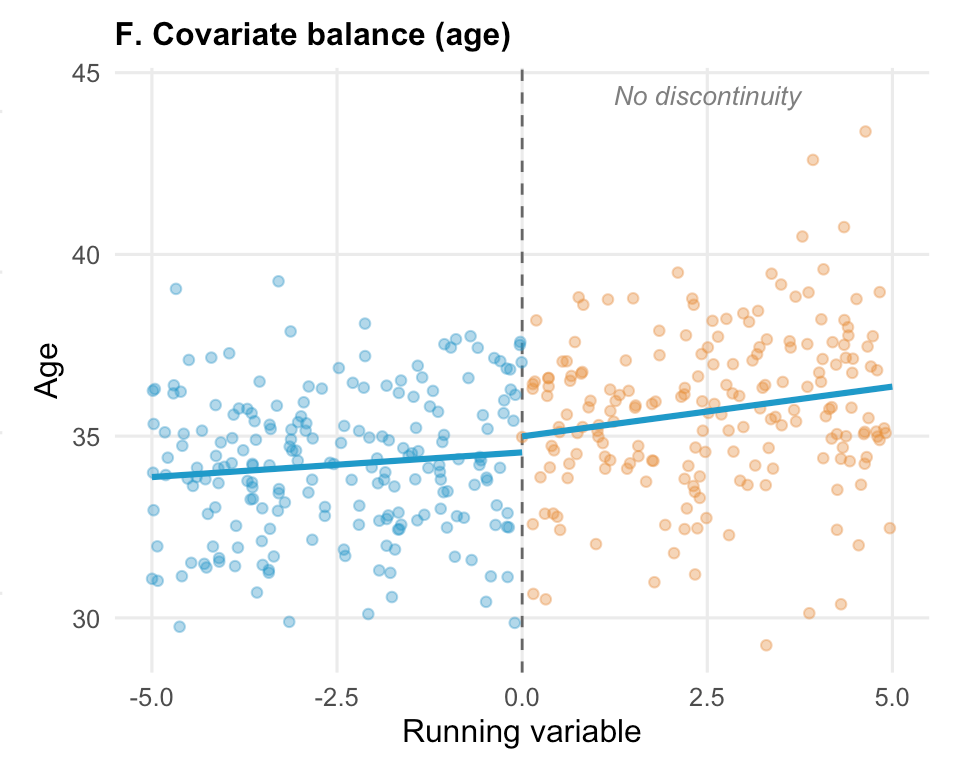
Anatomy of a regression discontinuity design. (F) A covariate is continuous across the cutoff, supporting the as-if random assumption. Reproduced from Chapter 11.
Slide 10
Ontario, 2007
Ontario's publicly funded HPV vaccination program for grade 8 girls
Born on or after January 1, 1994: free vaccination at school
Born before that date: roughly $400 out of pocket
Otherwise nearly identical on average
Slide 11
Smith et al., 2015
Does HPV vaccination encourage riskier sexual behavior?
A concern that suppressed coverage in some jurisdictions
If true, pregnancy and non-HPV infection rates could rise
Slide 12
Smith et al., 2015
Birth date as the running variable
Collapsed into birth-year quarters
Outcome: pregnancy or non-HPV STI, grades 10 to 12
Administrative health data covering 260,493 girls
Slide 13
Smith et al., 2015
What happened at the birth-date cutoff
All three doses
Eligible girls: 51%
Ineligible girls: less than 1%
Pregnancy or STI
Risk difference −0.61 per 1,000
95% CI −10.71 to 9.49
Relative risk 0.96 (0.81 to 1.14)
Slide 14
In Closing
Why regression discontinuity worked well in this study
The running variable, birth date, can't be manipulated
The cutoff was sharp, known and enforced
A sample large enough to detect modest effects
Administrative data avoided self-report bias
Regression discontinuity
Slide 1Whenever a continuous measure crosses a bright line and treatment access switches on or off, we have the ingredients for a regression discontinuity design.
Programs that assign treatment at a threshold
Antiretroviral therapy when a CD4 count falls below a cutoff
Scholarships when test scores exceed a minimum
Subsidies when income falls below a poverty line
Slide 2Many programs and policies assign treatment based on a threshold. Patients qualify for antiretroviral therapy if their CD4 count falls below a cutoff. Students receive scholarships if their test scores exceed a minimum. Households get subsidies if their income falls below a poverty line.
Why are people just above and just below a cutoff comparable?
CD4 counts of 495 and 505 differ by a measurement that could have gone the other way
In a narrow window, assignment is effectively arbitrary
Slide 3Regression discontinuity exploits a simple insight: people just above and just below a threshold should be nearly identical on average. The person with a CD4 count of 495 and the person with a count of 505 differ by a measurement that could easily have gone the other way. In a narrow window around the cutoff, assignment to treatment is effectively arbitrary, because the running variable contains enough noise that who lands on which side is close to random. When this holds, comparing outcomes for people just above and just below the cutoff gives us a credible causal estimate, sometimes approaching the rigor of a randomized trial.
Regression discontinuity
A running variable, a cutoff and a discontinuity
Regression discontinuity design. Reproduced from Chapter 11.
Slide 4The design requires three ingredients. First, a running variable, some continuous measure like a test score, age, or CD4 count. Second, a cutoff, a known threshold that determines access to treatment. And third, a discontinuity: treatment probability jumps at that cutoff.
Diagnostics
Sharp and fuzzy designs
Anatomy of a regression discontinuity design. (A) In a sharp RD, treatment probability jumps from 0 to 1 at the cutoff. (B) In a fuzzy RD, it jumps but not completely. Reproduced from Chapter 11.
Slide 5These are the plots we'll encounter in a regression discontinuity paper. The first two show the distinction between sharp and fuzzy designs. In a sharp design, treatment probability jumps from 0% to 100% at the cutoff. Everyone below is untreated, and everyone above is treated. In a fuzzy design, the jump is real but incomplete. Some people below the cutoff receive treatment anyway, and some above don't. A fuzzy design uses instrumental variables logic to estimate the effect among compliers.
Diagnostics
A jump in the outcome at the cutoff
Anatomy of a regression discontinuity design. (C) The main RD plot shows a clear jump in the outcome at the cutoff. Reproduced from Chapter 11.
Slide 6The main plot should show a clear discontinuity in the outcome at the cutoff, with smooth trends on either side. The jump at the threshold is the treatment effect. The visual should be convincing to someone who knows nothing about regression.
Diagnostics
The density plot is a check for manipulation
Anatomy of a regression discontinuity design. (D) The density of the running variable is smooth, with no pile-up suggesting manipulation. Reproduced from Chapter 11.
Slide 7The density plot is the manipulation check. The distribution of the running variable should be smooth across the cutoff. A pile-up of observations just below the threshold, or a gap just above, suggests people are gaming the system. This single diagnostic can make or break a regression discontinuity study.
Diagnostics
Placebo cutoffs
Anatomy of a regression discontinuity design. (E) A placebo cutoff shows no jump where none should exist. Reproduced from Chapter 11.
Slide 8Placebo cutoffs test whether the method is finding real effects or fitting noise. We apply the same analysis at fake cutoffs where no treatment change occurred. If we find effects at these locations, the method is detecting something other than the treatment.
Diagnostics
Covariate balance across the cutoff
Anatomy of a regression discontinuity design. (F) A covariate is continuous across the cutoff, supporting the as-if random assumption. Reproduced from Chapter 11.
Slide 9Covariate balance shows that baseline characteristics are continuous across the cutoff. If covariates jump at the threshold, something other than treatment is changing, and that undermines the as-if random logic.
Ontario, 2007
Ontario's publicly funded HPV vaccination program for grade 8 girls
Born on or after January 1, 1994: free vaccination at school
Born before that date: roughly $400 out of pocket
Otherwise nearly identical on average
Slide 10When Ontario launched its publicly funded HPV vaccination program for grade 8 girls in September 2007, it created a sharp eligibility cutoff based on birth date. Girls born on or after January 1, 1994, were in grade 8 when the program started and could receive the vaccine at school for free. Girls born before that date were in grade 9 or higher and had to pay roughly $400 out of pocket. Girls born just before and just after the cutoff are, on average, nearly identical in every respect except that one group was eligible for free vaccination and the other wasn't.
Smith et al., 2015
Does HPV vaccination encourage riskier sexual behavior?
A concern that suppressed coverage in some jurisdictions
If true, pregnancy and non-HPV infection rates could rise
Slide 11Researchers used this cutoff to answer a question that had become a barrier to vaccination uptake: does HPV vaccination encourage riskier sexual behavior? Parents worried that vaccinating girls against a sexually transmitted infection would create a false sense of protection and lead to more sexual activity. If that were true, the vaccine could increase pregnancy and other sexually transmitted infections. The concern was plausible enough to suppress vaccination coverage in some jurisdictions.
Smith et al., 2015
Birth date as the running variable
Collapsed into birth-year quarters
Outcome: pregnancy or non-HPV STI, grades 10 to 12
Administrative health data covering 260,493 girls
Slide 12The running variable is birth date, collapsed into birth-year quarters. The outcome is a composite of pregnancy and sexually transmitted infections not related to HPV between grades 10 and 12, measured through Ontario's population-based administrative health databases covering 260,493 girls. The manipulation check is trivially satisfied, since no one chose their birth date to qualify for an HPV vaccine that wouldn't exist for another decade.
Smith et al., 2015
What happened at the birth-date cutoff
All three doses
Eligible girls: 51%
Ineligible girls: less than 1%
Pregnancy or STI
Risk difference −0.61 per 1,000
95% CI −10.71 to 9.49
Relative risk 0.96 (0.81 to 1.14)
Slide 13The first stage is clear. Among eligible girls, 51% received all three vaccine doses, and among ineligible girls, less than 1% did. On the outcome side, the researchers found no jump at all. The relative risk was 0.96, with a 95% confidence interval from 0.81 to 1.14, and results were similar when pregnancy and infections were examined separately. The concern that HPV vaccination promotes risky sexual behavior was not supported.
In Closing
Why regression discontinuity worked well in this study
The running variable, birth date, can't be manipulated
The cutoff was sharp, known and enforced
A sample large enough to detect modest effects
Administrative data avoided self-report bias
Slide 14This study illustrates why the design can be so powerful. Birth date is impossible to manipulate. The cutoff is sharp, known, and enforced through school enrollment records. The sample is large enough to detect even modest effects. And the administrative data avoids the self-report biases that plagued earlier studies comparing vaccinated to unvaccinated girls directly, a comparison hopelessly confounded by the health beliefs and family characteristics that influence both vaccination decisions and sexual behavior.