Chapter 10 · Video 5
Running the trial: fidelity, monitoring, and reporting
Print layout
Slide 1


Running the trial: fidelity, monitoring, and reporting
Slide 2
Was the intervention delivered as intended?
Sometimes RCTs fail because the intervention was never actually delivered
Slide 3
Implementation fidelity
Fidelity is harder to verify for behavioral and health system interventions
Pills: we can measure blood levels of the drug
Complex behavioral interventions and health system changes: much harder
Slide 4
George et al., 2021
What the CHoBI7 trial tracked
Reach: what proportion of households received each component?
Dose: how many mHealth messages and home visits occurred?
Fidelity: were messages delivered as intended, covering all key topics?
Acceptability: did participants find it acceptable and useful?
Slide 5
Two very different explanations for a null result
It doesn’t work
Participants received it as intended
Outcomes didn’t improve
It wasn’t delivered
They didn’t receive all of it
So of course outcomes didn’t improve
Slide 6
Monitoring process and monitoring outcomes
The study team
Weekly data quality checks, site visits
Enrollment, follow-up, adverse events
Never outcome data by treatment arm
Only the DSMB
Unblinded outcome data by arm
At pre-specified interim analyses
Slide 7
Data Safety Monitoring Board
An independent committee that sees what the investigators don’t
Clinicians, biostatisticians, and ethicists not involved in the trial
Can recommend stopping for clear benefit, unexpected harm, or futility
Slide 8
Why repeated looks at outcome data raise the false-positive rate
Five looks, each at alpha = 0.05
Overall false positive rate: about 14%, not 5%
Slide 9
O’Brien-Fleming boundaries for five planned analyses
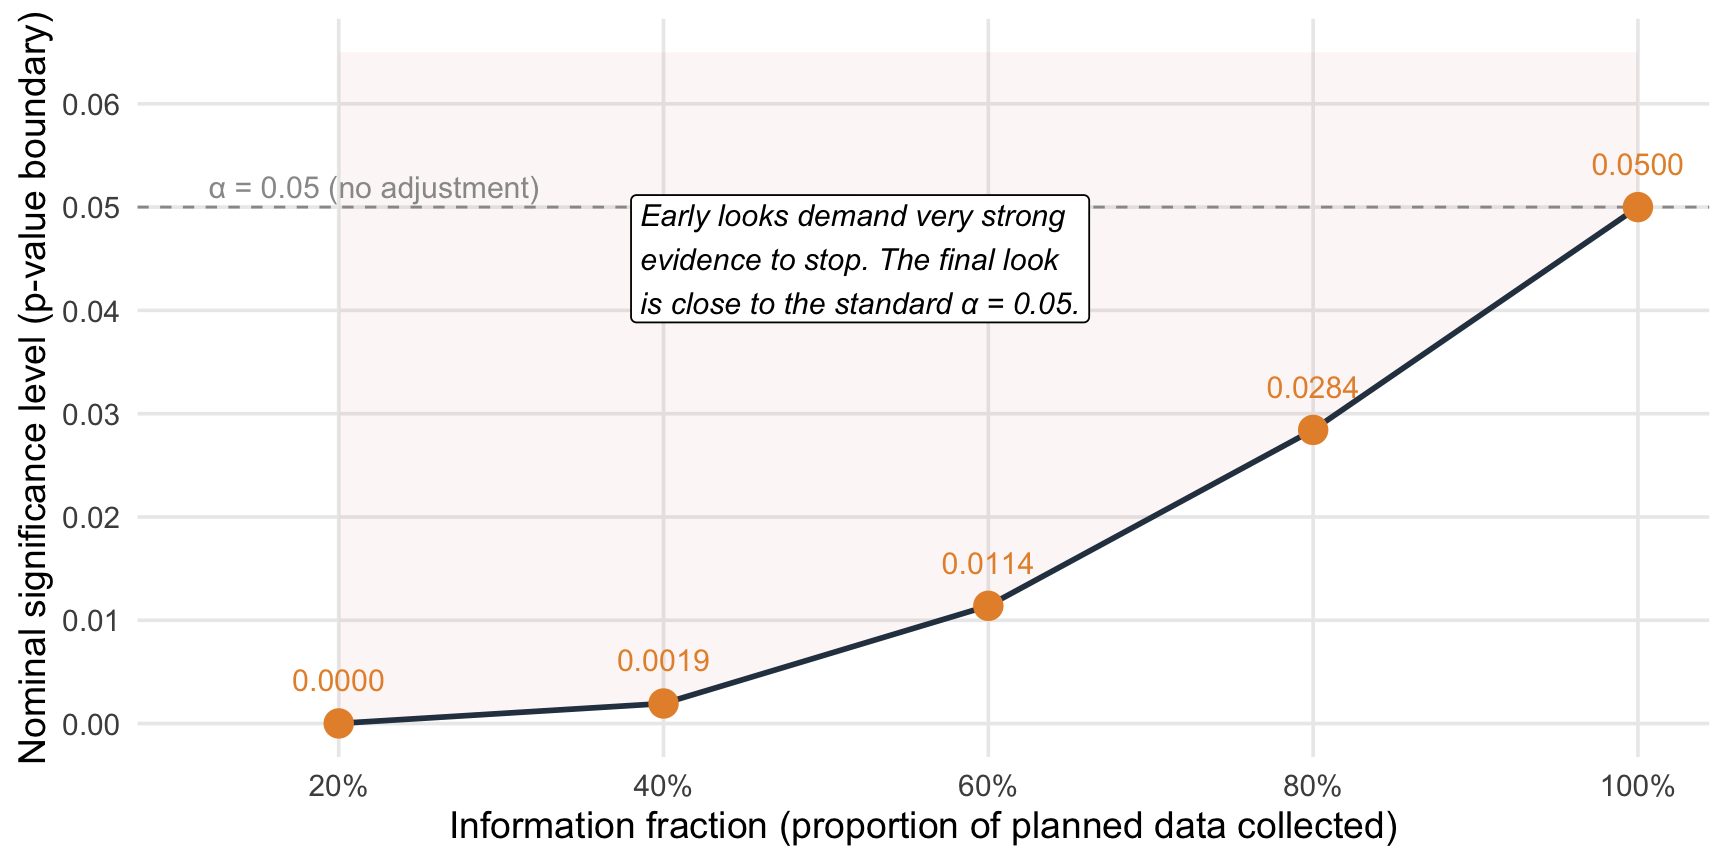
Early looks require extremely strong evidence (very small p-values) to justify stopping; the final analysis uses a threshold close to the conventional alpha = 0.05. Reproduced from Chapter 10.
Slide 10
Auvert 2005; Bailey 2007; Gray 2007
Three trials of male circumcision for HIV prevention
Orange Farm, South Africa
Kisumu, Kenya
Rakai, Uganda
Slide 11
Auvert 2005; Bailey 2007; Gray 2007
The interim analyses that stopped all three trials
Orange Farm, 2005: a 60% reduction in HIV incidence at a planned interim analysis
Kenya and Uganda followed: 53% and 51% reductions
Slide 12
Gray et al., 2021
A trial stopped for futility
HVTN 702, an HIV vaccine trial in South Africa
The independent monitoring committee found no evidence of efficacy
Slide 13
Setting up a DSMB
Independent experts willing to serve
A charter: when interim analyses occur, what triggers a stopping recommendation
Required for any trial where serious adverse events are plausible
Slide 14
CONSORT
Reporting a trial so readers can judge it
Consolidated Standards of Reporting Trials
A flow diagram and a checklist
Slide 15
The Orange Farm trial: assessment to randomization
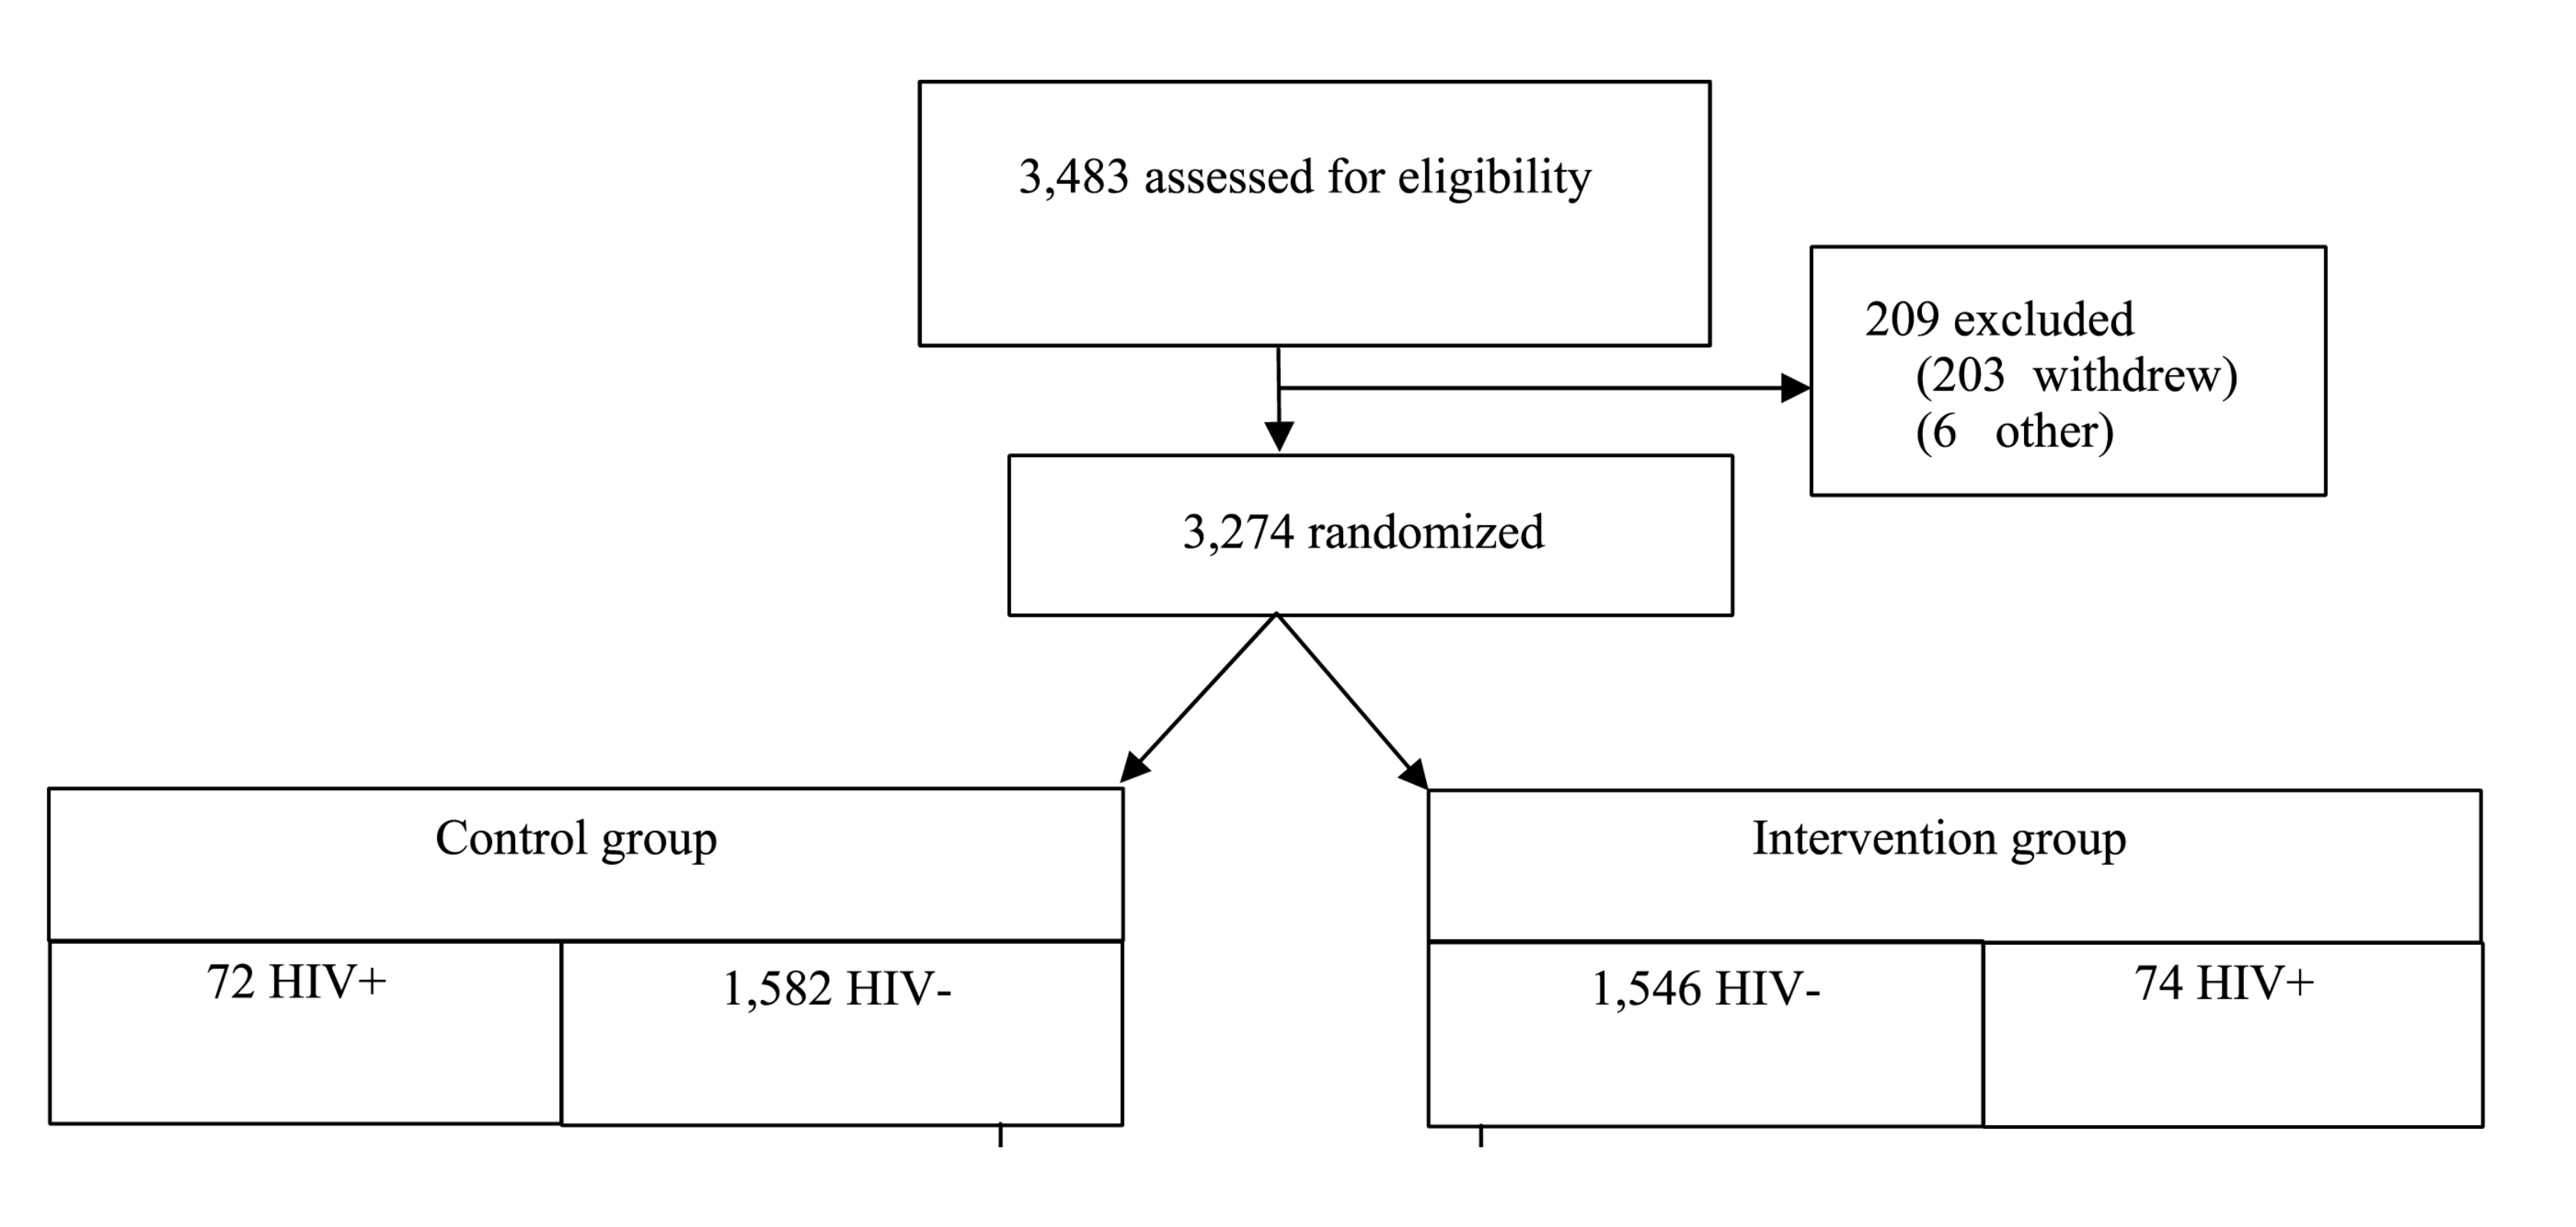
CONSORT flow diagram from the ANRS 1265 trial of male circumcision for HIV prevention, Orange Farm, South Africa (top portion). Source: Auvert et al., 2005, CC BY.
Slide 16
The Orange Farm trial: follow-up and analysis in each arm
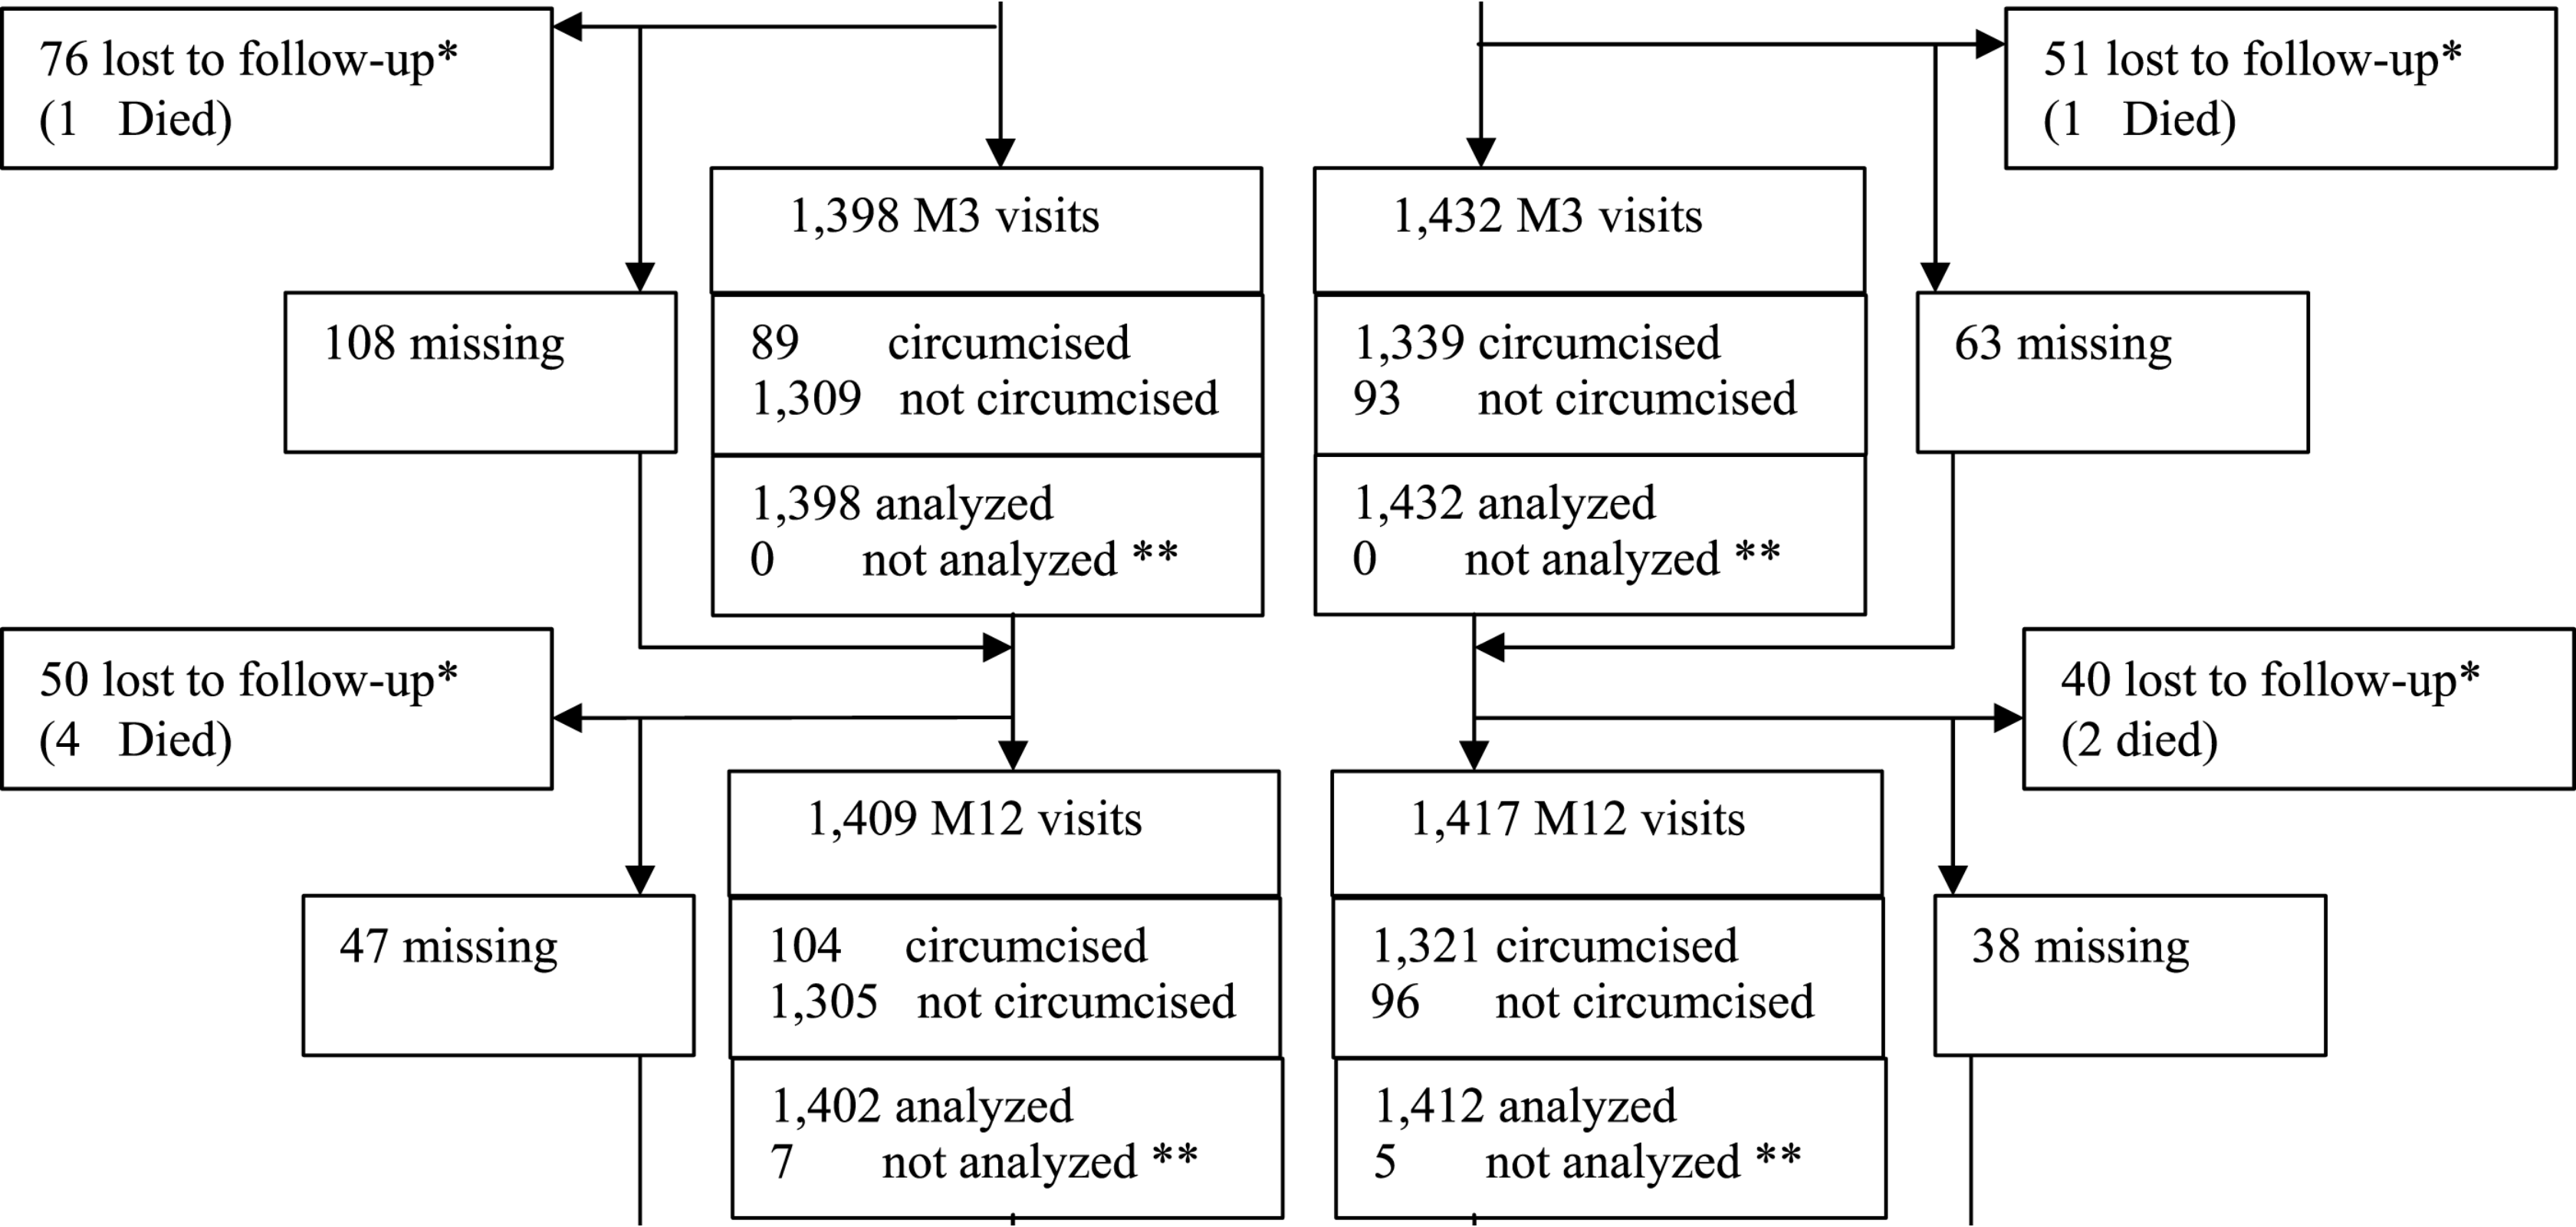
Losses to follow-up, missed visits, and numbers analyzed at months 3 and 12, by arm (middle portion of the same diagram). Source: Auvert et al., 2005, CC BY.
Slide 17
consort-statement.org
The CONSORT checklist and its extensions
25 items covering the full arc of a trial report
Extensions: cluster, non-inferiority and equivalence, pragmatic, social and psychological, equity
Slide 18
In Closing
Randomization gives us a fair comparison at baseline
Between randomization and analysis, things go wrong
Running the trial: fidelity, monitoring, and reporting
Slide 1Once a trial is designed and approved, we actually have to do the study. That means enrolling participants, delivering interventions, collecting data, and monitoring quality, and then reporting what happened.
Was the intervention delivered as intended?
Sometimes RCTs fail because the intervention was never actually delivered
Slide 2Sometimes RCTs fail, and the reason isn't that the intervention doesn't work. It's that the intervention was never actually delivered as intended.
Implementation fidelity
Fidelity is harder to verify for behavioral and health system interventions
Pills: we can measure blood levels of the drug
Complex behavioral interventions and health system changes: much harder
Slide 3This is the challenge of implementation fidelity: making sure the intervention is delivered consistently and as designed to everyone randomized to receive it. In pharmaceutical RCTs, fidelity is relatively straightforward, because we can verify that participants took their pills by measuring blood levels of the drug. In complex behavioral interventions or health system changes, fidelity is much harder to ensure and verify.
George et al., 2021
What the CHoBI7 trial tracked
Reach: what proportion of households received each component?
Dose: how many mHealth messages and home visits occurred?
Fidelity: were messages delivered as intended, covering all key topics?
Acceptability: did participants find it acceptable and useful?
Slide 4A trial in Bangladesh of the Cholera Hospital-based Intervention for 7 Days is a good example of thinking seriously about implementation. The intervention delivered health education through facility-based counseling, mobile health messages, and home visits, and the research team tracked four implementation outcomes. Reach: what proportion of enrolled households actually received each intervention component? Dose: how many mobile health messages were delivered? How many home visits occurred? Fidelity: were intervention messages delivered as intended, covering all key topics? And acceptability: did participants find the intervention acceptable and useful?
Two very different explanations for a null result
It doesn’t work
Participants received it as intended
Outcomes didn’t improve
It wasn’t delivered
They didn’t receive all of it
So of course outcomes didn’t improve
Slide 5By measuring those outcomes systematically, the researchers could distinguish between an intervention that doesn't work, where participants received it as intended and outcomes still didn't improve, and an intervention that wasn't delivered properly. This kind of process evaluation should be embedded in every global health RCT. Without it, a negative result leaves us with profound uncertainty. Did the intervention fail because the underlying theory was wrong, because the intervention was poorly designed, or because implementation challenges kept it from ever really happening?
Monitoring process and monitoring outcomes
The study team
Weekly data quality checks, site visits
Enrollment, follow-up, adverse events
Never outcome data by treatment arm
Only the DSMB
Unblinded outcome data by arm
At pre-specified interim analyses
Slide 6If we wait until data collection is complete to examine data quality, we've waited too long. But there's an important distinction between monitoring process and monitoring outcomes, and getting it wrong can compromise both our blinding and our statistical validity. The study team can and should review data at least weekly for missing data, implausible values, or signs of fabrication, visit sites, monitor enrollment and follow-up, and track serious adverse events, all without breaking the blind. Looking at outcome data by treatment arm is a different matter entirely.
Data Safety Monitoring Board
An independent committee that sees what the investigators don’t
Clinicians, biostatisticians, and ethicists not involved in the trial
Can recommend stopping for clear benefit, unexpected harm, or futility
Slide 7Examining outcome data is the province of the Data Safety Monitoring Board, or DSMB. It's an independent committee, typically clinicians, biostatisticians, and ethicists who aren't involved in the trial. The DSMB sees unblinded outcome data that the investigators don't, and reviews it at pre-specified interim analyses. It has the authority to recommend stopping the trial early for three reasons: clear benefit has been demonstrated and continuing would be unethical, unexpected harm has emerged, or futility analyses suggest no benefit will be found even with full enrollment.
Why repeated looks at outcome data raise the false-positive rate
Five looks, each at alpha = 0.05
Overall false positive rate: about 14%, not 5%
Slide 8This raises a statistical subtlety. Every time we look at outcome data and potentially stop the trial, we increase the chance of a false positive. If we test our data five times during a trial at an alpha of 0.05 each time, the overall false positive rate climbs to about 14%, not 5%.
O’Brien-Fleming boundaries for five planned analyses
Early looks require extremely strong evidence (very small p-values) to justify stopping; the final analysis uses a threshold close to the conventional alpha = 0.05. Reproduced from Chapter 10.
Slide 9Group sequential methods solve this by adjusting the significance threshold at each interim look. The most common approach, O'Brien-Fleming boundaries, uses very stringent criteria early, when data are sparse. We might need a p-value below 0.0001 to stop. The criteria relax later, and the final analysis uses something close to 0.05. That way the overall Type I error rate stays at 5% across all the looks combined.
Auvert 2005; Bailey 2007; Gray 2007
Three trials of male circumcision for HIV prevention
Orange Farm, South Africa
Kisumu, Kenya
Rakai, Uganda
Slide 10The male circumcision trials in Africa are one of the most striking examples of ethical stopping in global health. Three independent RCTs tested whether voluntary medical male circumcision reduced HIV acquisition in men: one in Orange Farm, South Africa, one in Kisumu, Kenya, and one in Rakai, Uganda.
Auvert 2005; Bailey 2007; Gray 2007
The interim analyses that stopped all three trials
Orange Farm, 2005: a 60% reduction in HIV incidence at a planned interim analysis
Kenya and Uganda followed: 53% and 51% reductions
Slide 11The South African trial was stopped first. At a planned interim analysis in 2005, the DSMB found a 60% reduction in HIV incidence among circumcised men, an effect so large that continuing to randomize men to the control group would have meant knowingly withholding a protective intervention. The Kenya and Uganda trials followed shortly after, stopped by their own DSMBs after showing 53% and 51% reductions.
Gray et al., 2021
A trial stopped for futility
HVTN 702, an HIV vaccine trial in South Africa
The independent monitoring committee found no evidence of efficacy
Slide 12Stopping can also go the other direction. The HVTN 702 HIV vaccine trial in South Africa was stopped for futility when the independent data monitoring committee found no evidence of efficacy. In both cases, stopping for benefit and stopping for futility, the monitoring boards faced a genuine tension between gathering more data and acting on what they already knew. Group sequential methods exist to make those decisions rigorous.
Setting up a DSMB
Independent experts willing to serve
A charter: when interim analyses occur, what triggers a stopping recommendation
Required for any trial where serious adverse events are plausible
Slide 13Setting up a DSMB requires recruiting independent experts willing to serve and establishing a charter that specifies when interim analyses will occur and what criteria will trigger stopping recommendations. For smaller trials or lower-risk interventions, a simpler safety monitoring plan may suffice. But for any trial where serious adverse events are plausible, independent safety monitoring isn't optional.
CONSORT
Reporting a trial so readers can judge it
Consolidated Standards of Reporting Trials
A flow diagram and a checklist
Slide 14When it's time to write up the results, we need to report them in a way that lets readers evaluate the quality and validity of our findings. The CONSORT statement, the Consolidated Standards of Reporting Trials, provides an evidence-based minimum set of recommendations for reporting RCTs. A trial might be well designed and carefully conducted, but if the paper doesn't describe the randomization process, show the flow of participants, or present baseline characteristics, readers can't tell whether the results are trustworthy. CONSORT has two core components, the flow diagram and the checklist.
The Orange Farm trial: assessment to randomization
CONSORT flow diagram from the ANRS 1265 trial of male circumcision for HIV prevention, Orange Farm, South Africa (top portion). Source: Auvert et al., 2005, CC BY.
Slide 15The flow diagram tracks participants through the trial, from initial assessment for eligibility through randomization, allocation, follow-up, and final analysis. This is the flow diagram from the Orange Farm trial we just saw stopped, which randomized 3,274 uncircumcised men. How many people were screened? How many were excluded, and why?
The Orange Farm trial: follow-up and analysis in each arm
Losses to follow-up, missed visits, and numbers analyzed at months 3 and 12, by arm (middle portion of the same diagram). Source: Auvert et al., 2005, CC BY.
Slide 16How many were lost to follow-up in each arm? How many were included in the final analysis? This single figure tells readers more about a trial's integrity than pages of prose. When these numbers don't add up, we know something went wrong.
consort-statement.org
The CONSORT checklist and its extensions
25 items covering the full arc of a trial report
Extensions: cluster, non-inferiority and equivalence, pragmatic, social and psychological, equity
Slide 17The CONSORT checklist is a list of 25 items covering everything a reader needs to evaluate a trial, and many journals require it at submission. I'd recommend downloading it before you start writing up your results, because it's much easier to collect the right information prospectively than to reconstruct it after the fact. CONSORT also has extensions for trial types common in global health, including cluster randomized trials, non-inferiority trials, and CONSORT-Equity, for health equity trials.
In Closing
Randomization gives us a fair comparison at baseline
Between randomization and analysis, things go wrong
Slide 18Randomization gives us a fair comparison at baseline. But between randomization and analysis, things go wrong, and that's where we'll pick up in the next video.