Chapter 14 · Video 4
The synthetic control method
Print layout
Slide 1


The synthetic control method
Slide 2
Chelwa et al., 2017
South Africa raised cigarette excise taxes from 1994 to 2004
By 2004 the real excise tax had climbed by 249%
The average retail price had climbed by 110%
Per capita consumption fell
Slide 3
Synthetic control
Consumption was already falling before 1994
The economy was contracting
Public health awareness was building
Modest regulatory steps were underway
Slide 4
Abadie et al., 2010
A synthetic control is a weighted combination of untreated units
No single country is a clean comparison for South Africa
Weights are chosen so the combination tracks the treated unit's pre-intervention trajectory
If it tracks well before, it is a credible estimate of what would have happened after
Slide 5
Synthetic control
How a synthetic control is built
Identify the treated unit and the intervention date
Assemble a donor pool and choose matching predictors
Solve for non-negative weights that sum to one and minimize the pre-period gap
Project forward; the gap after the intervention is the estimated effect
Slide 6
Chelwa et al., 2017
The five countries that make up synthetic South Africa
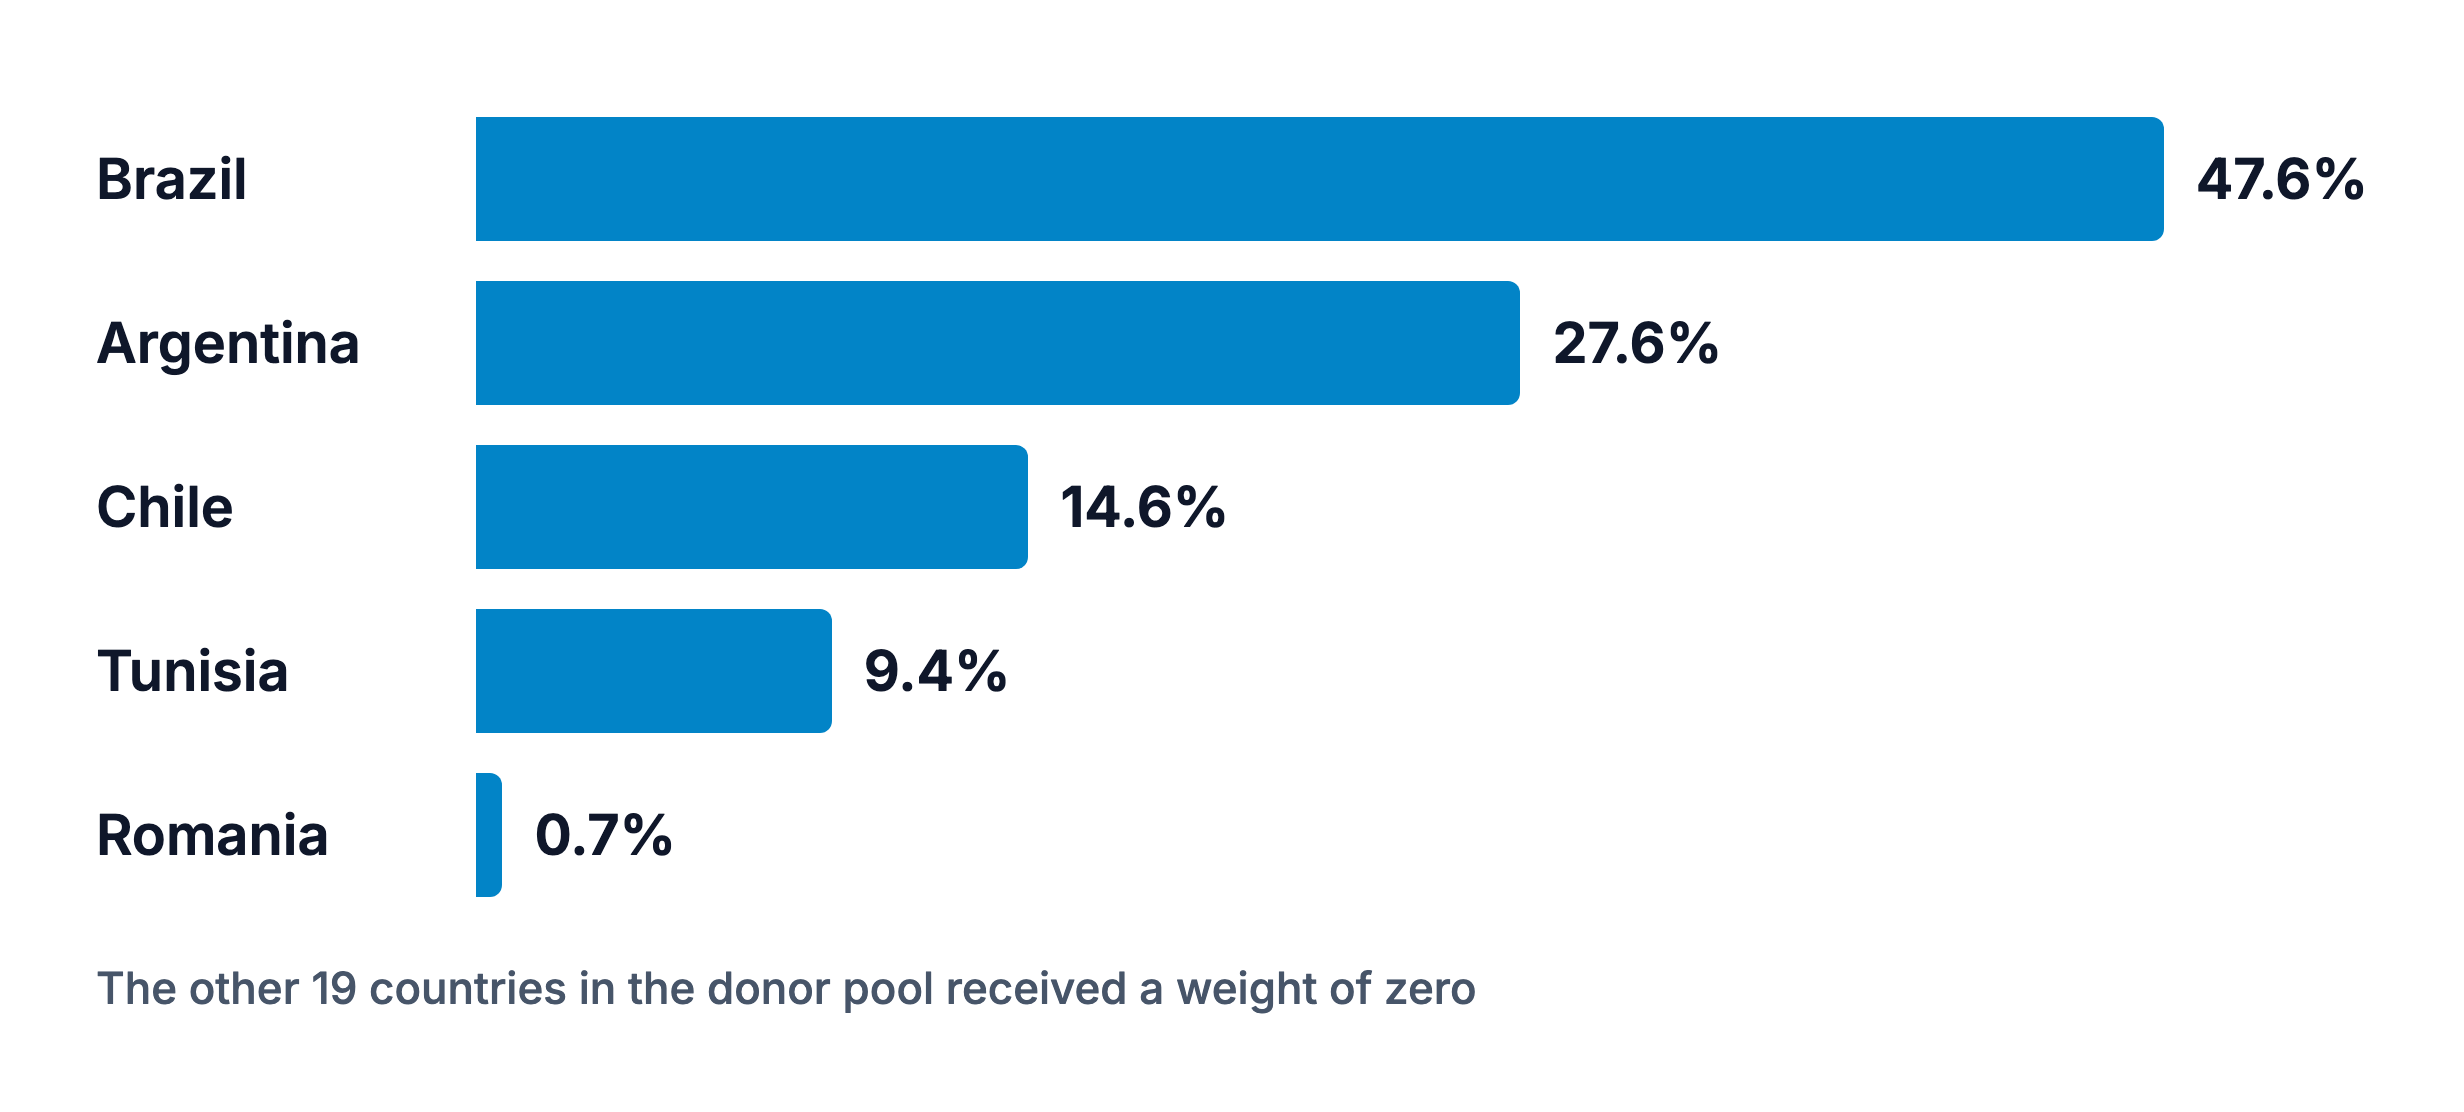
Weights from a donor pool of 24 countries without large-scale tobacco control during the study period. Values as reported in Chapter 14.
Slide 7
Chelwa et al., 2017
South Africa and its synthetic control, before and after 1994
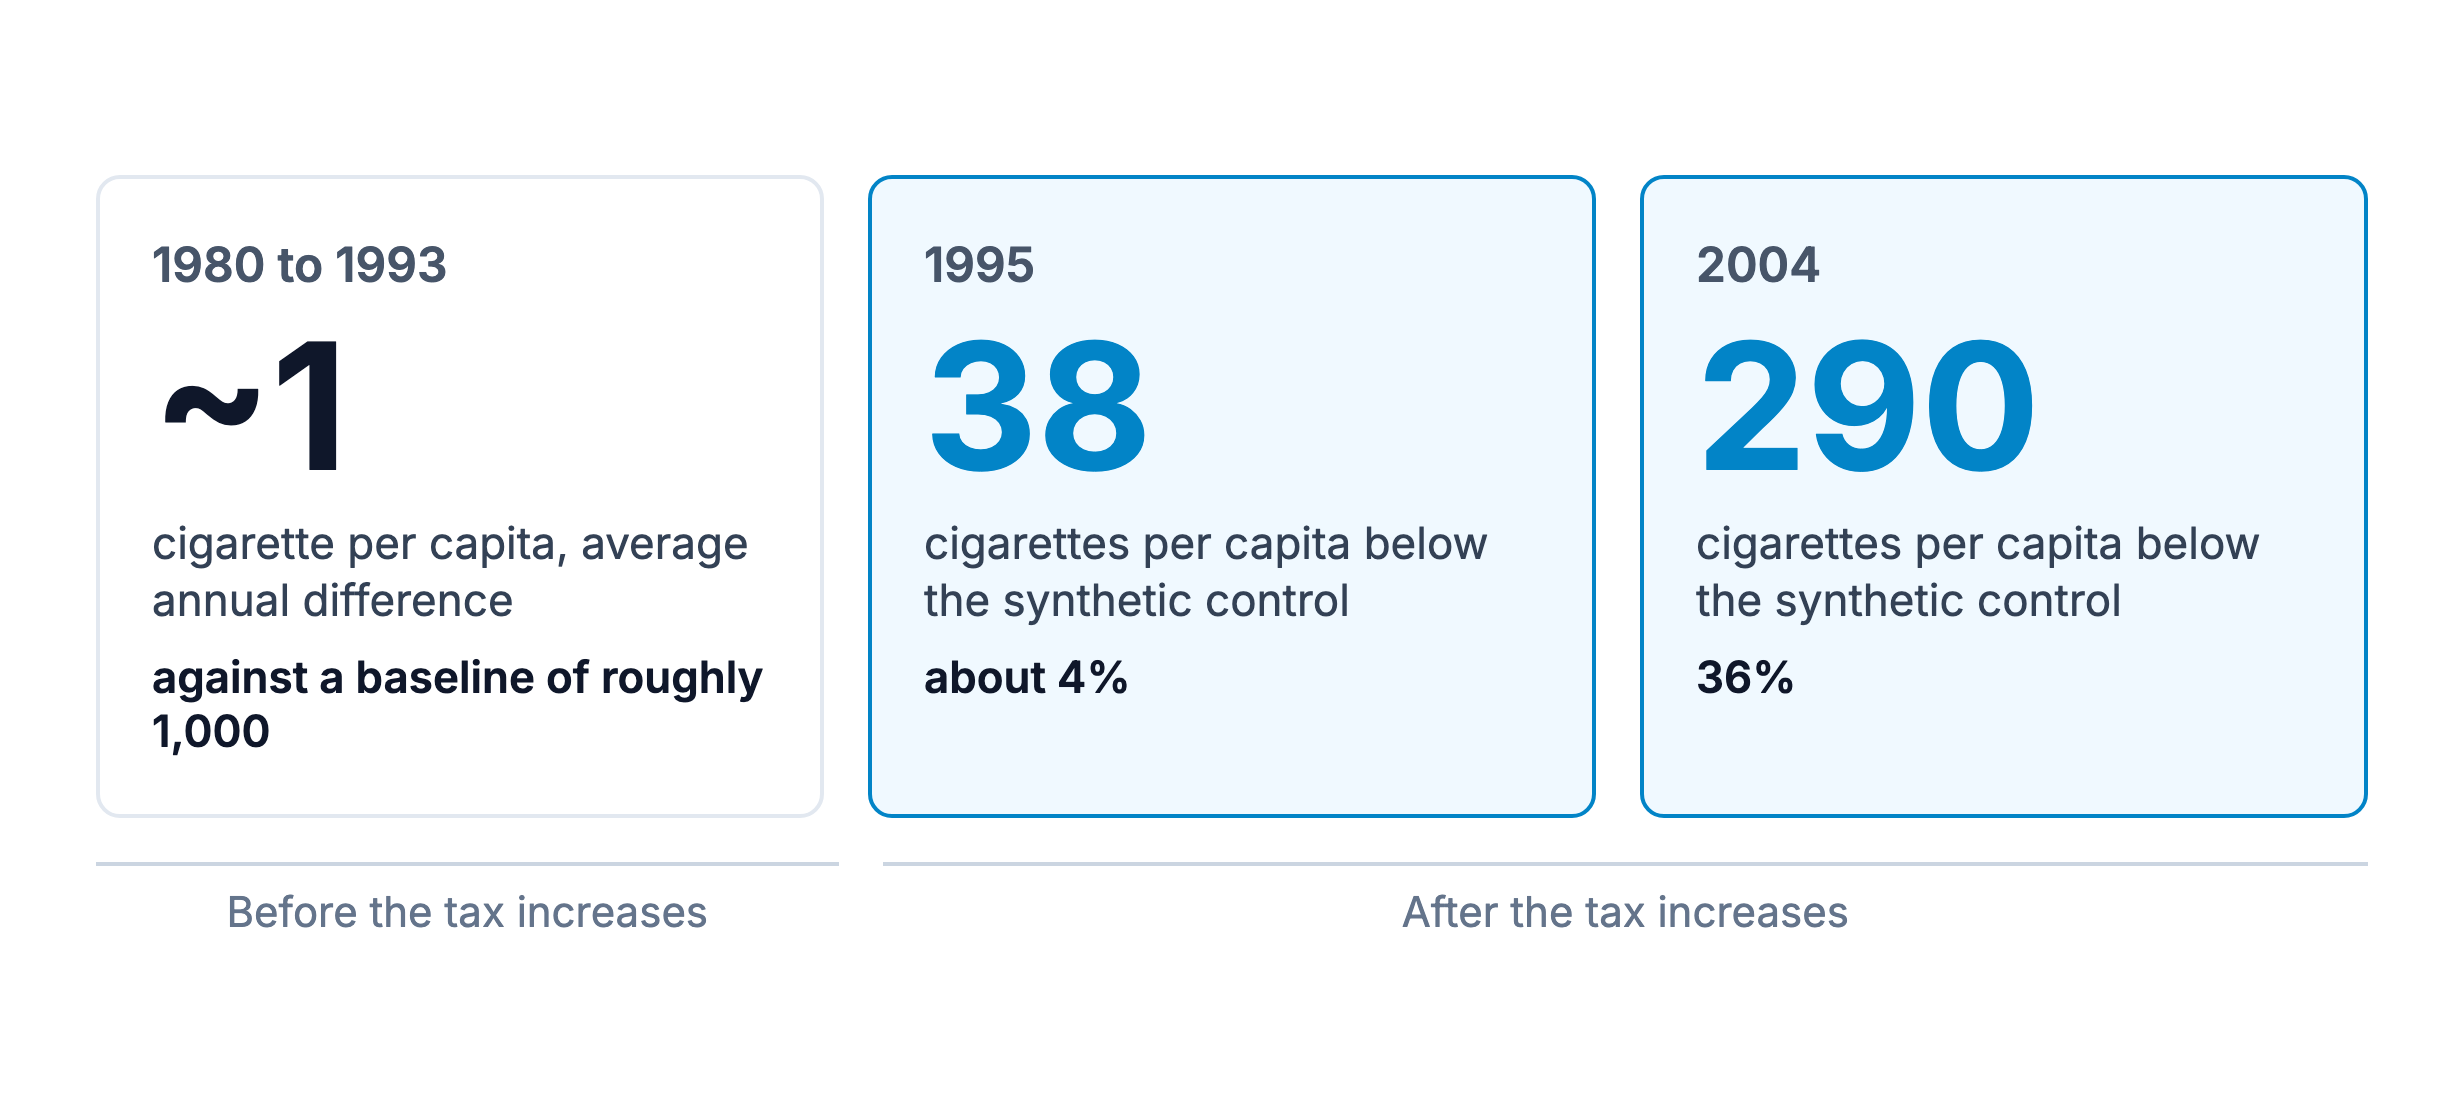
Difference between actual and synthetic cigarette consumption per capita, as stated in Chapter 14. The study's full annual series is not shown here.
Slide 8
Checking the estimate
Did the pre-intervention fit actually match?
The two series should track closely before the intervention
If they diverge in the pre-period, the later gap isn't a clean estimate of the effect
Slide 9
Leave-one-out
Could a single donor country be driving the result?
Re-estimate the synthetic control after dropping each donor unit in turn
Brazil carried nearly half the weight, and the divergence held without it
An alternative donor pool gave a similar trajectory
Slide 10
In-space placebos
How synthetic control studies argue for statistical significance
Apply the same procedure to each donor country, as if it were the treated unit
An unusually large effect for the treated country is evidence the result isn't just noise
The method doesn't yield a confidence interval the way regression does
Slide 11
Synthetic control
When to use synthetic control
One unit, usually a country, region, or state, experienced the intervention
A credible donor pool of comparable untreated units
Several years of pre-intervention data
Slide 12
Ahsan et al., 2025
Estimating the mortality impact of U.S. global health investments
16 recipient countries aggregated into a single treated unit
Synthetic control built from 19 nonrecipient countries
1.0 to 1.3 million deaths averted among women of reproductive age, 2009 to 2019
Slide 13
Chelwa et al., 2017
Something else may change at the same time as the intervention
If something else shifted the treated unit's trajectory, the estimate captures both
This limitation is shared by every counterfactual estimator
The South Africa analysis ended in 2004, before international efforts reached the donors
Slide 14
Synthetic control
Three further constraints on synthetic control
Pre-intervention fit has to be good
The donor pool has to be rich enough to approximate the treated unit
Be cautious of studies that report standard p-values without explaining how
The synthetic control method
Slide 1Synthetic control methods estimate what would have happened to a single treated unit, like a country, by weighting together untreated units.
Chelwa et al., 2017
South Africa raised cigarette excise taxes from 1994 to 2004
By 2004 the real excise tax had climbed by 249%
The average retail price had climbed by 110%
Per capita consumption fell
Slide 2In 1994, the newly elected government in South Africa began aggressively raising cigarette excise taxes. By 2004, the real excise tax had climbed by 249%, and the average retail price by 110%. Per capita consumption fell, and the natural conclusion is that the tax policy caused the decline.
Synthetic control
Consumption was already falling before 1994
The economy was contracting
Public health awareness was building
Modest regulatory steps were underway
Slide 3But consumption was already falling before 1994. The economy was contracting, public health awareness was building, and modest regulatory steps were underway. A simple before-and-after comparison would credit the tax for declines that were happening anyway. The question every policy evaluator faces in moments like this is, what would have happened without the intervention?
Abadie et al., 2010
A synthetic control is a weighted combination of untreated units
No single country is a clean comparison for South Africa
Weights are chosen so the combination tracks the treated unit's pre-intervention trajectory
If it tracks well before, it is a credible estimate of what would have happened after
Slide 4We can't observe that directly, and no single country is a clean comparison. Every other low- or middle-income country differs from South Africa on demographics, economy, baseline consumption, and regulatory environment, and matching and regression adjustment aren't built for a setting with one treated unit. Synthetic control methods are. We construct a counterfactual by weighting together untreated units so the weighted average closely tracks the treated unit's trajectory before the intervention. If it tracks well before, it provides a credible estimate of what would have happened after.
Synthetic control
How a synthetic control is built
Identify the treated unit and the intervention date
Assemble a donor pool and choose matching predictors
Solve for non-negative weights that sum to one and minimize the pre-period gap
Project forward; the gap after the intervention is the estimated effect
Slide 5The procedure runs in five steps. First, identify the treated unit and the intervention date. Second, assemble a donor pool of untreated units that are plausible building blocks. Third, choose matching predictors, the variables believed to drive the outcome. Fourth, solve for weights that minimize the gap between the treated unit and the synthetic control in the pre-period. The weights are non-negative and sum to one, so the synthetic control is an interpolation among real units, not an extrapolation beyond them. Fifth, project it forward, and the gap after the intervention is the estimated effect.
Chelwa et al., 2017
The five countries that make up synthetic South Africa
Weights from a donor pool of 24 countries without large-scale tobacco control during the study period. Values as reported in Chapter 14.
Slide 6One team built a synthetic South Africa from a donor pool of 24 countries that hadn't implemented large-scale tobacco control during the study period. They matched on the real price of cigarettes, real GDP per capita, per capita alcohol consumption, the proportion of adults in the population, and lagged cigarette consumption. The optimization gave positive weights to five countries: Brazil at 47.6%, Argentina at 27.6%, Chile at 14.6%, Tunisia at 9.4%, and Romania at 0.7%. The rest received zero.
Chelwa et al., 2017
South Africa and its synthetic control, before and after 1994
Difference between actual and synthetic cigarette consumption per capita, as stated in Chapter 14. The study's full annual series is not shown here.
Slide 7From 1980 to 1993, this weighted combination tracked South Africa's cigarette consumption almost exactly. The average annual difference was about one cigarette per capita, against a baseline of roughly 1,000. After the tax increases took effect, the two series diverged. By 1995, the first full post-policy year, South Africa's consumption was 38 cigarettes per capita below the synthetic counterfactual, about 4%. By 2004, the gap had widened to 290 cigarettes, 36% below what consumption would have been without the tax increases.
Checking the estimate
Did the pre-intervention fit actually match?
The two series should track closely before the intervention
If they diverge in the pre-period, the later gap isn't a clean estimate of the effect
Slide 8A synthetic control study lives or dies on two questions. Did the pre-intervention fit actually match? And could the estimated effect be driven by something other than the intervention? The first is visual. We should be able to see the two series tracking closely before the intervention, and if they diverge in the pre-period, the gap after it isn't a clean treatment effect estimate.
Leave-one-out
Could a single donor country be driving the result?
Re-estimate the synthetic control after dropping each donor unit in turn
Brazil carried nearly half the weight, and the divergence held without it
An alternative donor pool gave a similar trajectory
Slide 9The second question comes from sensitivity checks, and the clearest is leave-one-out. We re-estimate the synthetic control after dropping each donor unit in turn. If the result depended on a single country, say Brazil, which carried nearly half the weight, dropping it should make the estimated effect collapse. It didn't. The pattern of divergence held across all five leave-one-out specifications, and synthetic South Africa's trajectory was similar under an alternative donor pool.
In-space placebos
How synthetic control studies argue for statistical significance
Apply the same procedure to each donor country, as if it were the treated unit
An unusually large effect for the treated country is evidence the result isn't just noise
The method doesn't yield a confidence interval the way regression does
Slide 10A third common check is the in-space placebo. We apply the same procedure to each donor country, treating it as if it were the treated unit. If the actual treated country's estimated effect is unusually large compared to the placebo effects, that's evidence the result isn't just noise. This permutation logic is how synthetic control studies typically argue for statistical significance, because the method doesn't yield a confidence interval the way regression does.
Synthetic control
When to use synthetic control
One unit, usually a country, region, or state, experienced the intervention
A credible donor pool of comparable untreated units
Several years of pre-intervention data
Slide 11Synthetic control fits a specific gap in the quasi-experimental toolkit. We use it when one unit, usually a country, region, or state, experienced an intervention, and we have a credible donor pool of comparable untreated units along with several years of pre-intervention data. National or sub-national policies are the natural target: tobacco taxes, abortion restrictions, and large-scale funding shifts.
Ahsan et al., 2025
Estimating the mortality impact of U.S. global health investments
16 recipient countries aggregated into a single treated unit
Synthetic control built from 19 nonrecipient countries
1.0 to 1.3 million deaths averted among women of reproductive age, 2009 to 2019
Slide 12One study used a variant of the approach to estimate the mortality impact of U.S. global health investments. It aggregated 16 recipient countries into a single treated unit and constructed the synthetic control from 19 nonrecipient countries. The conservative estimate was 1.0 to 1.3 million deaths averted among women of reproductive age between 2009 and 2019.
Chelwa et al., 2017
Something else may change at the same time as the intervention
If something else shifted the treated unit's trajectory, the estimate captures both
This limitation is shared by every counterfactual estimator
The South Africa analysis ended in 2004, before international efforts reached the donors
Slide 13The method's deepest limitation is shared by every counterfactual estimator. If something else shifted the treated unit's trajectory at the same time as the intervention, the estimated effect captures both. The South Africa team handled this by ending their analysis in 2004, before broader international tobacco-control efforts began affecting many of the donor countries and contaminating the comparison.
Synthetic control
Three further constraints on synthetic control
Pre-intervention fit has to be good
The donor pool has to be rich enough to approximate the treated unit
Be cautious of studies that report standard p-values without explaining how
Slide 14Three additional constraints matter. Pre-intervention fit has to be good, and without it, the method isn't reliable. The donor pool has to be rich enough that a combination of donor units can plausibly approximate the treated unit, and if the treated unit is too unusual relative to anything available, the method can't produce a good match. And inference is permutation-based, not classical, so be cautious of synthetic control studies that report standard p-values without explaining how they arrived at them.