Chapter 6 · Video 4
What a p-value doesn’t tell you
Print layout
Slide 1


What a p-value doesn't tell you
Slide 2
Caveats and considerations
Statistical significance does not imply clinical significance
It tells the world only that the result was sufficiently surprising to reject the null
Surprising by your definition of surprising, which is alpha
It does not mean "meaningful" or "important" in the colloquial sense
Slide 3
You can buy significance by collecting more data
Increasing the sample size will shrink the p-value
A medication that lowers average systolic blood pressure from 120 to 119, p < 0.05
Always report effect sizes, not just p-values
Slide 4
Your p-value is not "trending toward significance"
Results are either above the alpha level you set, or below it
You may not modify "significant" with "trending" or "marginally" or "approaching"
p-values are not a measure of the strength of your evidence
Slide 5
A non-significant finding does not equal "no effect"
All you can take away is that the result is not sufficiently surprising under the null
The effect may be small — too small to detect with a small sample size
The vitamin D trial we opened this chapter on is an example of this mistake in print
Slide 6
A p-value is not the probability that the null hypothesis is true
What p = 0.03 means
A 3% chance of seeing data this extreme
If the null were true
P(D|H)
What people hear
A 3% chance of no effect
Full stop
P(H|D)
Slide 7
Criticisms
The Frequentist approach dominates, and has lots of critics
More than 800 scientists signed a proposal to abandon statistical significance
Some journals have banned reporting p-values
Others propose moving the bar from an alpha of 0.05 to 0.005
Slide 8
Wasserstein et al. · Meehl
Frustration with significance testing is not new
The American Statistical Association issued a statement on what a p-value does and does not tell us
People have been warning us for decades
It reached a boiling point when published findings could not be reproduced
Slide 9
John et al. · Ioannidis
The problem wasn't p-values per se
A constellation of questionable research practices that had become normalized
They inflate false positive rates even with no conscious intent to deceive
Some have estimated these practices could make most research findings false
Slide 10
The distribution of published p-values, piled up at the threshold
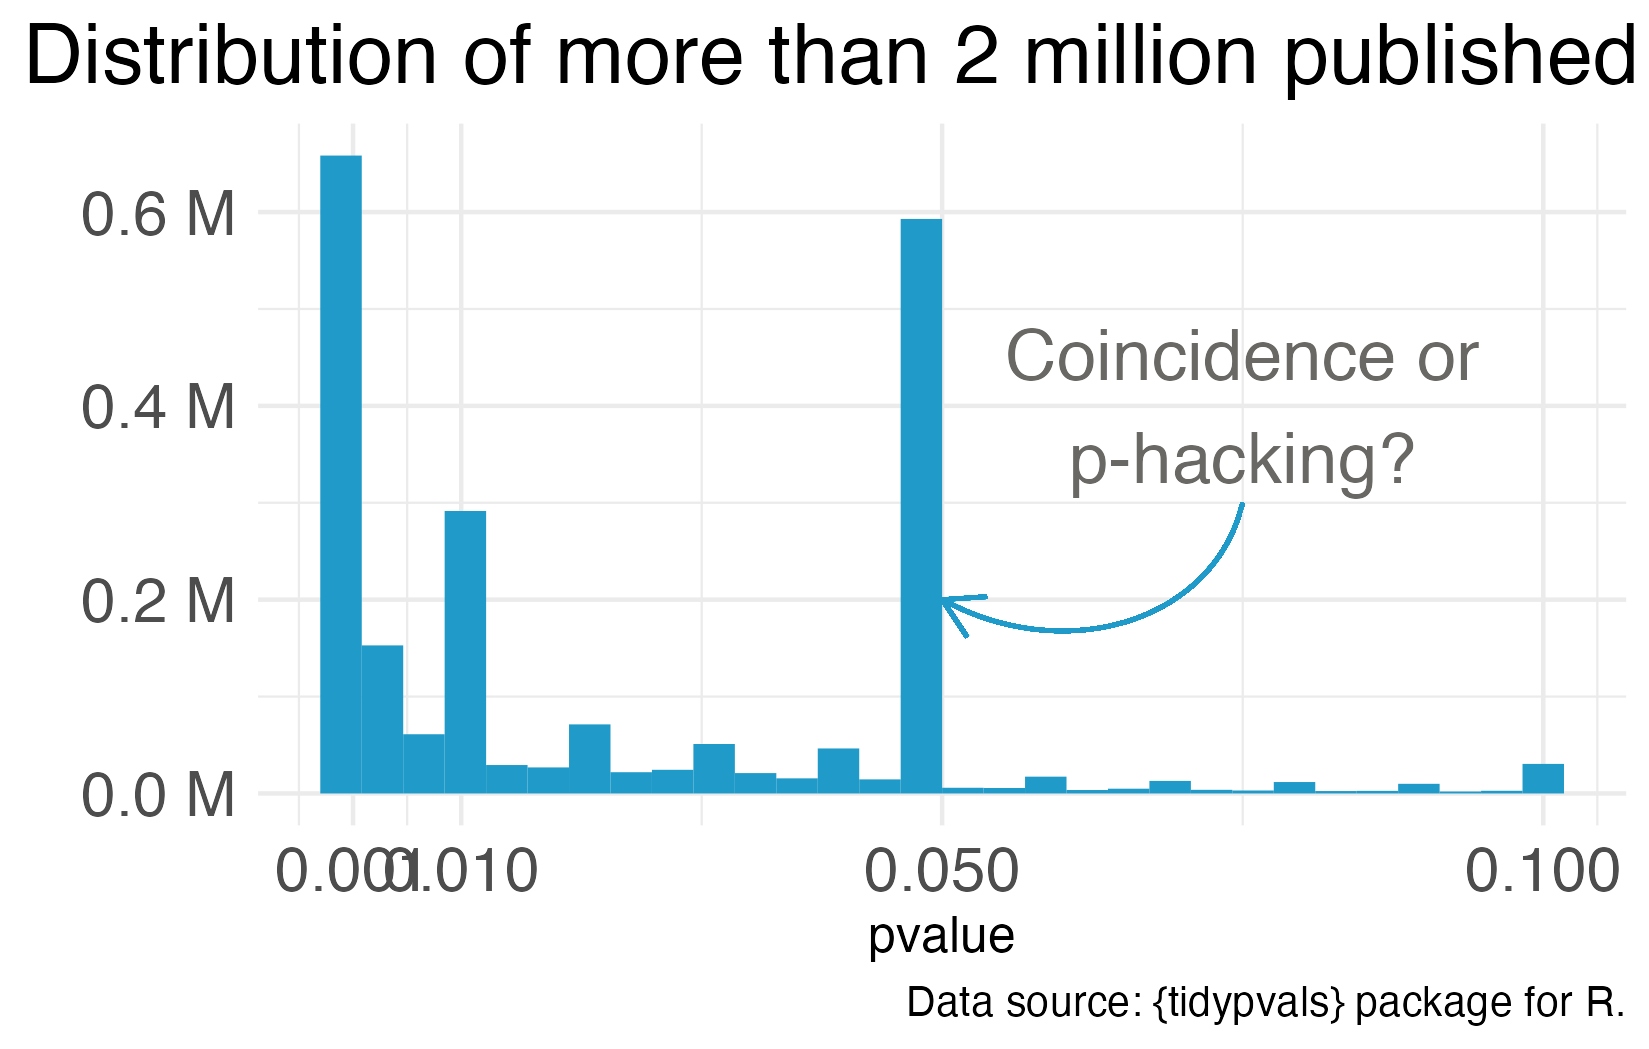
It's almost like you need a p-value less than 0.05 to get published. Reproduced from Chapter 6.
Slide 11
Data analysis is a garden of forking paths
Even simple analyses require the analyst to make lots of decisions
p-hacking is going down one path, finding 0.052, and turning around
To go down another path that leads to 0.049
Slide 12
It's not the p-value's fault that it's misunderstood and abused
Even the "abandon statistical significance" camp recognizes its value for some tasks
Their main criticism is that conventional use encourages dichotomous thinking
And when publication turns on p < 0.05, we distort the literature
Slide 13
Calin-Jageman et al., 2019
One way out of dichotomous thinking is to estimate
Focus on estimating effects, rather than testing null hypotheses
Instead of "Is there an effect?"
Ask "How big is the effect, and how uncertain are we about it?"
Slide 14
Panel A
The significance framing: is the difference significant?
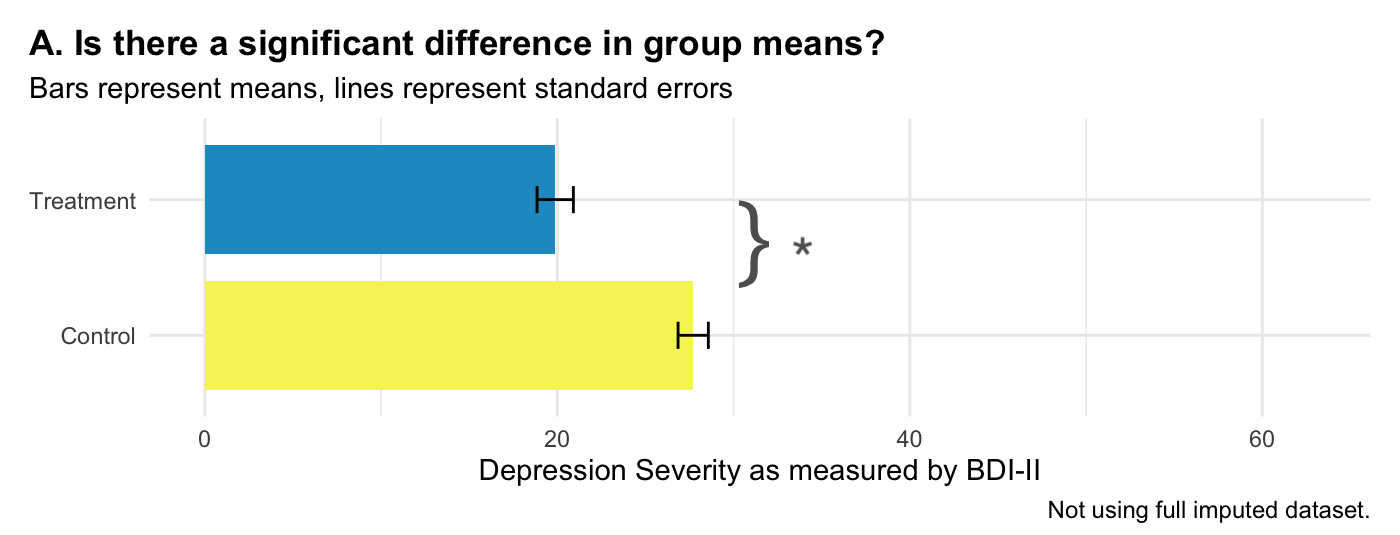
From statistical significance to estimation and quantification of uncertainty. 3-month endline data from the HAP trial. Reproduced from Chapter 6.
Slide 15
Panel B
The same group means, with every individual data point
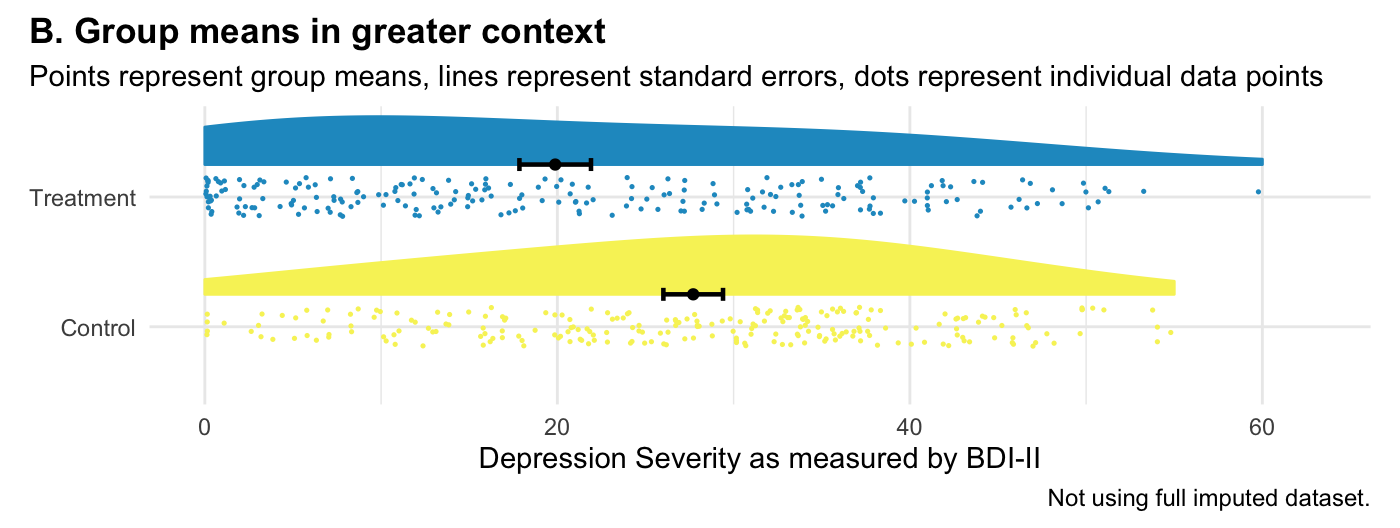
Many people in the treatment group remained at high levels of depression severity even though the group improved on average. Reproduced from Chapter 6.
Slide 16
Panel C
The estimate, and how uncertain we are about it
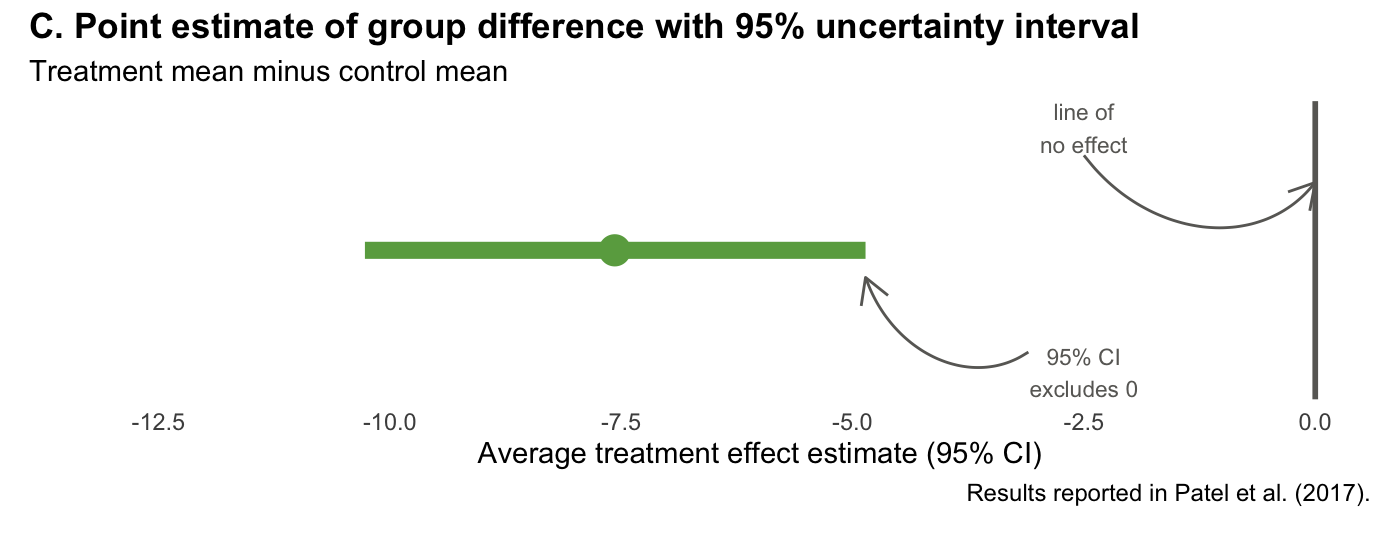
Point estimate of the group difference with a 95% uncertainty interval: -7.6 points, interval -10.3 to -4.9. Reproduced from Chapter 6.
Slide 17
Confidence intervals give you the p-value, plus more
The 95% interval excludes 0, so we know p < 0.05
Our best estimate is -7.6, and the data are consistent with -10.3 to -4.9
We can rule out effects larger than -10.3 and smaller than -4.9
Slide 18
In Closing
But confidence intervals are still Frequentist
Repeat the study many times and 95% of the intervals would contain the true value
That is a statement about a procedure, not about this specific interval
Reporting effect sizes and intervals is better practice than p-values alone
What a p-value doesn't tell you
Slide 1The last three videos built up the Frequentist machinery: hypotheses, an imaginary collective, goal posts, a decision. This video is about what that machinery does not deliver. Four misreadings of the p-value that survive peer review, the criticisms that have been leveled at significance testing, and the first thing you can do about it.
Caveats and considerations
Statistical significance does not imply clinical significance
It tells the world only that the result was sufficiently surprising to reject the null
Surprising by your definition of surprising, which is alpha
It does not mean "meaningful" or "important" in the colloquial sense
Slide 2Keep these in mind when you review manuscripts, or write up your own Frequentist analysis. First, statistical significance does not imply practical or clinical significance. To say that a result is statistically significant tells the world only that the result was sufficiently surprising to reject the null hypothesis. Surprising based on your definition of surprising, which is alpha, and on what data you could expect to see if the null hypothesis is true. It does not mean that your finding is significant in the colloquial sense of meaningful or important.
You can buy significance by collecting more data
Increasing the sample size will shrink the p-value
A medication that lowers average systolic blood pressure from 120 to 119, p < 0.05
Always report effect sizes, not just p-values
Slide 3In fact, you could get a statistically significant, but practically meaningless result just by collecting more data. Simply increasing the sample size will shrink the p-value. With enough resources, you could run a trial showing that a new medication significantly reduces average systolic blood pressure, the top number, from 120 to 119. Will a doctor start prescribing this new medication because there was enough data to statistically distinguish an effect size of 1 from 0? No, probably not. Whether reducing systolic blood pressure by 1 point on average is clinically or practically significant is completely separate from whether you have enough data to say that the effect is not zero. This is why you should always report effect sizes, not just p-values.
Your p-value is not "trending toward significance"
Results are either above the alpha level you set, or below it
You may not modify "significant" with "trending" or "marginally" or "approaching"
p-values are not a measure of the strength of your evidence
Slide 4Second, no, your p-value is not trending toward significance. In the Neyman-Pearson approach, results are either above the alpha level you set or below it. Statistically significant, or non-significant. You may not modify the word significant with language like trending, or marginally, or approaching. If you set alpha to 0.05 so your long term error rate is 5%, a p-value of 0.052 for a particular study is non-significant. p-values are not a measure of the strength of your evidence.
A non-significant finding does not equal "no effect"
All you can take away is that the result is not sufficiently surprising under the null
The effect may be small — too small to detect with a small sample size
The vitamin D trial we opened this chapter on is an example of this mistake in print
Slide 5Third, a non-significant finding does not equal no effect. A common mistake is to infer from a p-value of 0.052 that there is no effect or no difference. All you can take away from a p-value greater than your alpha threshold is that the result is not sufficiently surprising if the null hypothesis is true. It's possible that the effect is small. Too small for you to detect with a small sample size. The vitamin D and calcium trial we opened this chapter on is an example of this mistake in print.
A p-value is not the probability that the null hypothesis is true
What p = 0.03 means
A 3% chance of seeing data this extreme
If the null were true
P(D|H)
What people hear
A 3% chance of no effect
Full stop
P(H|D)
Slide 6Fourth, a p-value is not the probability that the null hypothesis is true. A p-value of 0.03 does not mean there's a 3% chance of no effect. It means there's a 3% chance of seeing data this extreme if the null were true. A very different statement. People often want to know the probability of the hypothesis given the data, but the p-value gives you the probability of the data given the hypothesis. This distinction trips up even experienced researchers.
Criticisms
The Frequentist approach dominates, and has lots of critics
More than 800 scientists signed a proposal to abandon statistical significance
Some journals have banned reporting p-values
Others propose moving the bar from an alpha of 0.05 to 0.005
Slide 7Now the criticisms. The Frequentist approach dominates the literature, but it's not without its critics. Lots of critics, in fact. More than 800 scientists signed on to a proposal to abandon statistical significance, and some journals have banned reporting p-values. Other researchers have proposed keeping significance testing, but redefining statistical significance to a higher bar, from an alpha of 0.05 to 0.005.
Wasserstein et al. · Meehl
Frustration with significance testing is not new
The American Statistical Association issued a statement on what a p-value does and does not tell us
People have been warning us for decades
It reached a boiling point when published findings could not be reproduced
Slide 8The misuse and misunderstanding of p-values and statistical significance is so widespread that the American Statistical Association issued a statement reminding scientists of what a p-value does and does not tell us. And frustration with null-hypothesis significance testing is not new. People have been warning us for decades. But in recent years, this frustration reached a boiling point when researchers began systematically trying to replicate published findings, and discovered that many of them couldn't be reproduced. This replication crisis shook the foundations of several scientific fields, and forced a reckoning with how p-values and significance testing were being used in practice.
John et al. · Ioannidis
The problem wasn't p-values per se
A constellation of questionable research practices that had become normalized
They inflate false positive rates even with no conscious intent to deceive
Some have estimated these practices could make most research findings false
Slide 9The problem wasn't p-values per se. It was a constellation of questionable research practices that had become normalized. Practices that inflate false positive rates even when researchers have no conscious intent to deceive. Some have estimated that these practices could make most research findings false.
The distribution of published p-values, piled up at the threshold
It's almost like you need a p-value less than 0.05 to get published. Reproduced from Chapter 6.
Slide 10Here is what that looks like in the published record. This is the distribution of p-values reported in the literature. Look at what happens right at the threshold. It's almost like you need a p-value less than 0.05 to get published.
Data analysis is a garden of forking paths
Even simple analyses require the analyst to make lots of decisions
p-hacking is going down one path, finding 0.052, and turning around
To go down another path that leads to 0.049
Slide 11One notorious questionable research practice goes hand in hand with significance testing: p-hacking. You see, Reader, data analysis is a garden of forking paths. Even simple analyses require the analyst to make lots of decisions. There are many pathways one can take to get from question to answer. p-hacking is going down one path, finding a p-value of 0.052, and turning around to go down another path that leads to 0.049. It's true that an analyst of any stripe can engage in a multitude of questionable practices, but p-hacking is uniquely Frequentist.
It's not the p-value's fault that it's misunderstood and abused
Even the "abandon statistical significance" camp recognizes its value for some tasks
Their main criticism is that conventional use encourages dichotomous thinking
And when publication turns on p < 0.05, we distort the literature
Slide 12Of course, it's not the p-value's fault that it's often misunderstood and abused. Even the abandon statistical significance camp recognizes its value for some tasks. Their main criticism is that the conventional use of p-values encourages us to think dichotomously. There either is an effect or there is not. And this is bad for science. Furthermore, when publication decisions are made on the basis of p less than 0.05, we distort the literature and encourage questionable practices. And when we encourage those practices, particularly when our sample sizes are small and we look for small effect sizes, we end up with a crisis. We publish a lot of noise that fails to replicate.
Calin-Jageman et al., 2019
One way out of dichotomous thinking is to estimate
Focus on estimating effects, rather than testing null hypotheses
Instead of "Is there an effect?"
Ask "How big is the effect, and how uncertain are we about it?"
Slide 13So let's consider an alternative. One way to avoid dichotomous thinking is to focus on estimating effects rather than testing null hypotheses. Instead of asking, is there an effect, ask, how big is the effect, and how uncertain are we about it? This next figure illustrates that shift using the depression trial results, in three panels.
Panel A
The significance framing: is the difference significant?
From statistical significance to estimation and quantification of uncertainty. 3-month endline data from the HAP trial. Reproduced from Chapter 6.
Slide 14Panel A shows the significance testing framing. Is the difference statistically significant? Yes. The bars are the group means, the lines are standard errors, and the asterisk is doing all the work.
Panel B
The same group means, with every individual data point
Many people in the treatment group remained at high levels of depression severity even though the group improved on average. Reproduced from Chapter 6.
Slide 15Panel B adds context by showing individual data points. Each dot is a person. This reminds us that many people in the treatment group remained at high levels of depression severity, even though the group improved on average.
Panel C
The estimate, and how uncertain we are about it
Point estimate of the group difference with a 95% uncertainty interval: -7.6 points, interval -10.3 to -4.9. Reproduced from Chapter 6.
Slide 16Panel C focuses on estimation. Here is the point estimate of the group difference, negative 7.6 points, and the 95% confidence interval around it, running from negative 10.3 to negative 4.9. Same data, and a different question being asked of it.
Confidence intervals give you the p-value, plus more
The 95% interval excludes 0, so we know p < 0.05
Our best estimate is -7.6, and the data are consistent with -10.3 to -4.9
We can rule out effects larger than -10.3 and smaller than -4.9
Slide 17Confidence intervals give us the same information as a p-value, plus more. The 95% interval excludes 0, so we know the p-value is less than 0.05. Our best estimate of the treatment effect is negative 7.6, but the data are consistent with effects ranging from negative 10.3 to negative 4.9. And we can rule out effects larger than negative 10.3 and smaller than negative 4.9.
In Closing
But confidence intervals are still Frequentist
Repeat the study many times and 95% of the intervals would contain the true value
That is a statement about a procedure, not about this specific interval
Reporting effect sizes and intervals is better practice than p-values alone
Slide 18But confidence intervals are still Frequentist. A 95% confidence interval means that if you repeated your study many times and calculated an interval each time, 95% of those intervals would contain the true value. It does not mean there's a 95% probability that the true value is in this specific interval. That's a subtle but important distinction. Bottom line: reporting effect sizes and confidence intervals is better practice than reporting p-values alone. But Frequentist confidence intervals still don't tell you the probability that your hypothesis is correct. For that, we need the Bayesian approach, and that's the next video.