MADRS Thresholds, MCID, and the Difference Between Statistical and Clinical Significance
Published
February 18, 2026
Part 1 of 2 on Compass Pathways’ COMP360 psilocybin program for treatment-resistant depression. This note examines what “clinically meaningful” means when applied to trial results. Part 2 addresses the challenge of blinding in psychedelic trials. This series is a companion to the Statistical Inference and Experimental Designs chapters of Global Health Research in Practice.
Eric talks with Dr. Jerry Rosenbaum who directs the Massachusetts General Hospital Center for the Neuroscience of Psychedelics about how he thinks about clinically meaningful in science and practice.
Compass Pathways recently reported results from two Phase 3 trials of COMP360, a synthetic psilocybin, for treatment-resistant depression.1 These follow a Phase 1 safety study in 89 healthy volunteers (Rucker et al., 2022) and a Phase 2b efficacy trial of 233 patients (Goodwin et al., 2022).2 In both Phase 3 studies, patients who received psilocybin experienced greater improvements than control groups on a standard depression rating scale. The company described 39% of treated patients as achieving a “clinically meaningful reduction.”
That phrase does a lot of work. Who decides what counts as clinically meaningful? What threshold separates a patient who responded from one who didn’t? And does a 3.8-point difference on a 60-point scale mean patients are getting better in ways they can feel?
Statistical significance answers one question: is there a signal? Clinical meaning answers a different one: does the signal matter? The two require different tools, different thresholds, and different reasoning. The Compass results offer a useful case for examining how those distinctions work in practice.
The MADRS
Both Compass trials used the Montgomery–Åsberg Depression Rating Scale (MADRS) as the primary outcome measure. The MADRS is a 10-item clinician-rated scale developed in 1979 to be sensitive to change during antidepressant treatment. Each item is scored from 0 (no symptoms) to 6 (severe symptoms), yielding a total score from 0 to 60.
Show code
madrs <-tibble(Item =1:10,Domain =c("Apparent sadness","Reported sadness","Inner tension","Reduced sleep","Reduced appetite","Concentration difficulties","Lassitude","Inability to feel","Pessimistic thoughts","Suicidal thoughts" ),Description =c("Observed dejection, gloom, despair (more than ordinary transient low spirits)","Subjective reports of depressed mood regardless of outward appearance","Feelings of ill-defined discomfort, edginess, inner turmoil, panic, dread","Reduced duration or depth of sleep compared to the subject's own normal pattern","Loss of appetite; need to force oneself to eat","Difficulties in collecting one's thoughts; reduced ability to focus","Difficulty getting started; slowness in initiating and performing everyday activities","Subjective experience of reduced interest in surroundings or activities that normally give pleasure","Thoughts of guilt, inferiority, self-reproach, sinfulness, remorse, ruin","Feeling that life is not worth living; suicidal thoughts and preparations for suicide" ))kable(madrs,caption ="MADRS items (Montgomery & Åsberg, 1979)") |>kable_styling(full_width =TRUE, font_size =14,bootstrap_options =c("condensed")) |>column_spec(1, width ="5%") |>column_spec(2, bold =TRUE, width ="18%")
MADRS items (Montgomery & Åsberg, 1979)
Item
Domain
Description
1
Apparent sadness
Observed dejection, gloom, despair (more than ordinary transient low spirits)
2
Reported sadness
Subjective reports of depressed mood regardless of outward appearance
3
Inner tension
Feelings of ill-defined discomfort, edginess, inner turmoil, panic, dread
4
Reduced sleep
Reduced duration or depth of sleep compared to the subject's own normal pattern
5
Reduced appetite
Loss of appetite; need to force oneself to eat
6
Concentration difficulties
Difficulties in collecting one's thoughts; reduced ability to focus
7
Lassitude
Difficulty getting started; slowness in initiating and performing everyday activities
8
Inability to feel
Subjective experience of reduced interest in surroundings or activities that normally give pleasure
9
Pessimistic thoughts
Thoughts of guilt, inferiority, self-reproach, sinfulness, remorse, ruin
10
Suicidal thoughts
Feeling that life is not worth living; suicidal thoughts and preparations for suicide
The MADRS has been one of the standard primary endpoints in antidepressant trials for decades and is now the most commonly used efficacy scale in registration studies. It is reliable, well-validated, and sensitive to pharmacological change. But it was designed for a specific therapeutic context—tricyclic and early SSRI trials—and it measures a specific set of constructs: sadness, tension, sleep, appetite, concentration, lassitude, anhedonia, pessimism, and suicidality.
Is the MADRS the right scale for psychedelics? What the MADRS does not measure is worth noting. There is no item for meaning, connectedness, or existential outlook—domains that psychedelic researchers frequently cite as central to the therapeutic experience. In a recent STAT article, Elaine Chen reported that Jerry Rosenbaum, director of Massachusetts General Hospital’s Center for the Neuroscience of Psychedelics, suggested that the MADRS was originally developed to assess traditional antidepressants and may not fully capture benefits that are more characteristic of psychedelic treatments, such as improvements in wellbeing or social functioning. This is not a criticism of the MADRS. It is a reminder that every scale embeds assumptions about what improvement looks like—a question of construct validity, which I discuss in the Measurement chapter. When those assumptions no longer match the treatment being evaluated, the scale may understate—or miss—the effects that matter most to patients.
For the sake of argument, let’s assume the MADRS is the right measure for the job. Even accepting the scale at face value, the results raise questions about what the numbers mean.
How Outcomes Are Reported
Clinical trials for depression typically report outcomes at three levels: mean difference (the primary analysis), response rates, and remission rates. These sound like they describe a continuum, but they rely on categorical thresholds, and the thresholds are conventions.
Difference in Change Scores
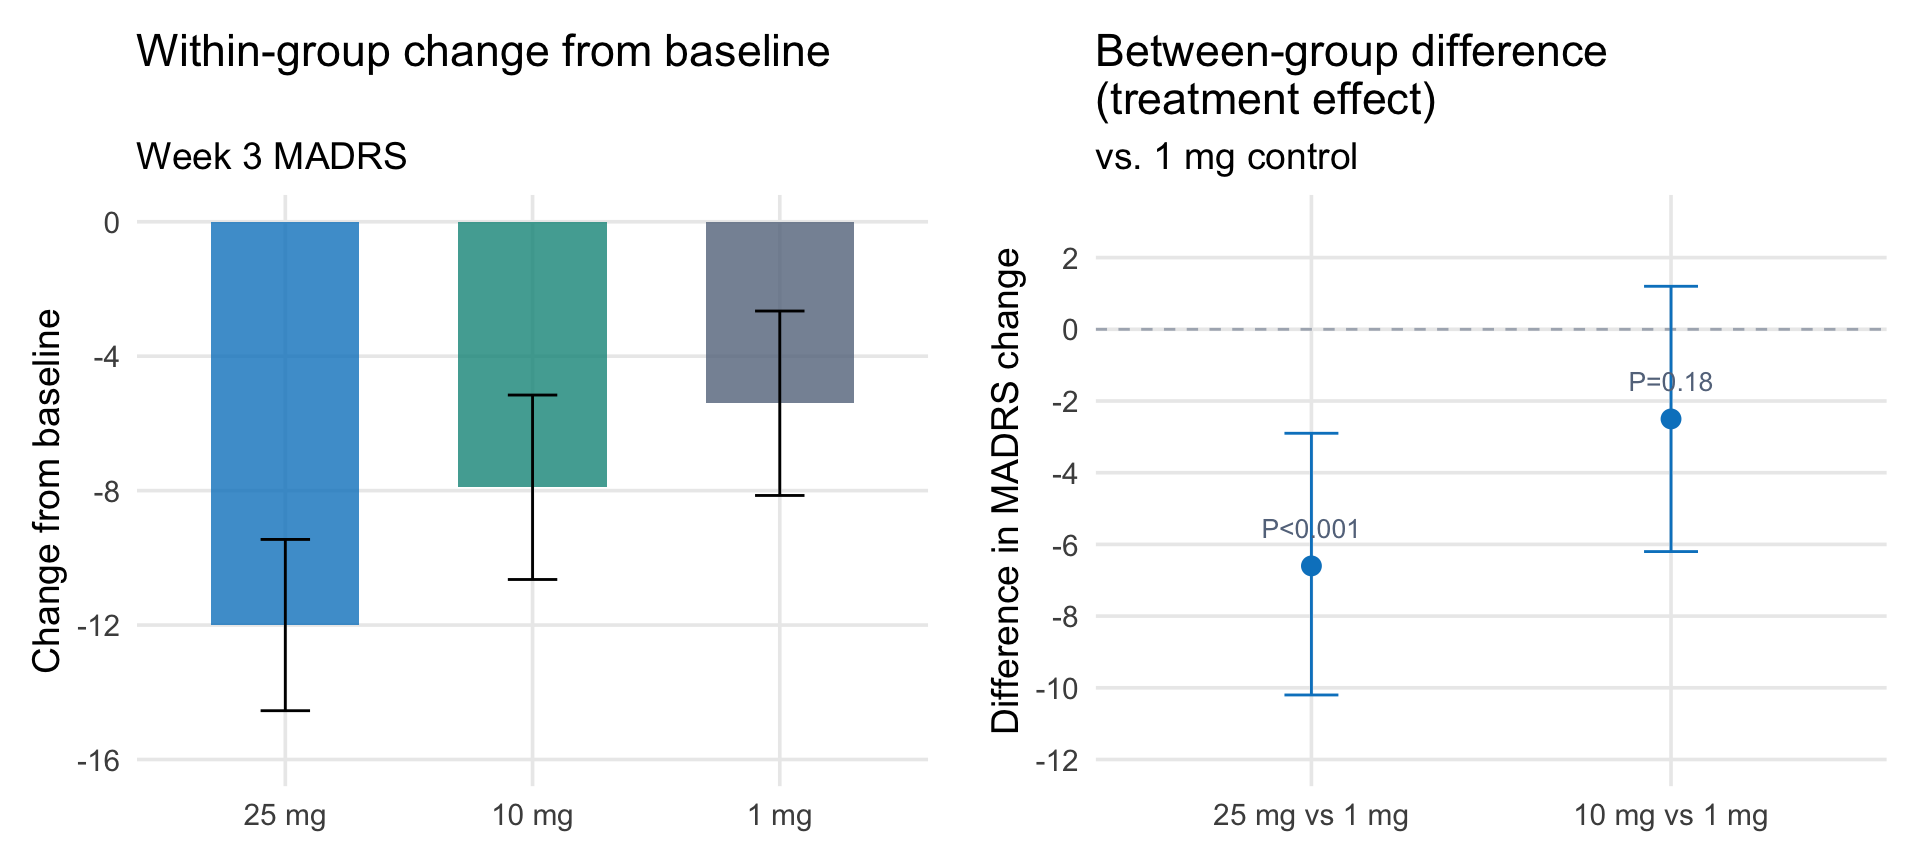
The primary endpoint in both the Phase 2b and Phase 3 Compass trials was the change from baseline in MADRS total score. In the Phase 2b trial, the 25 mg group improved by 12.0 points from baseline, the 10 mg group by 7.9 points, and the 1 mg control by 5.4 points. The 12-point improvement sounds large. But it is not the treatment effect—it is a within-group change that includes regression to the mean, the passage of time, the therapeutic setting, and any expectancy effects. The treatment effect is the difference between groups: 6.6 points.
This distinction matters because “change from baseline” is easy to misread. A press release that reports a 12-point improvement in the treatment arm and a 5-point improvement in the control arm sounds more impressive than a 6.6-point drug-control difference, even though they describe the same data.
Two ways to present the same Phase 2b data. Left: within-group change from baseline, which includes regression to the mean, passage of time, and the therapeutic setting. Right: the between-group difference, which estimates the treatment effect. Data from Goodwin et al. (2022).
In the Phase 3 trials, Compass has not released the within-group changes—only the between-group differences of 3.6 (COMP005, vs. placebo) and 3.8 (COMP006, vs. 1 mg). But the control groups in these trials also improved, perhaps substantially. In the Phase 2b, the 1 mg “control” group improved by 5.4 points on the MADRS—a non-trivial change for a dose intended to be sub-therapeutic. How much of that improvement was pharmacological, how much was regression to the mean, and how much was the structured therapeutic setting? The design cannot separate these.
There is a statistical reason to be cautious about change-from-baseline as an endpoint. When patients are selected for high baseline scores—as they are here, with a MADRS entry threshold of ≥20—regression to the mean inflates within-group improvement, and any chance imbalance in baseline severity between arms can bias the estimated treatment effect. Alternative analytic approaches—analysis of covariance (ANCOVA), mixed models for repeated measures (MMRM)—handle this more cleanly by conditioning on baseline rather than computing a difference score. In practice, most modern depression trials, including Compass’s Phase 2b, use MMRM with baseline as a covariate—so the analysis is more sophisticated than the “change from baseline” label suggests.
Response and Remission
Response is conventionally defined as a ≥50% reduction in MADRS score from baseline. A patient entering a trial with a MADRS of 30 who drops to 14 is a responder. A patient who drops to 16 is not. The clinical difference between a score of 14 and 16 may be negligible, but the convention draws a line.
Compass used a different threshold: ≥25% reduction, which it labeled a “clinically meaningful reduction.” By that measure, 39% of patients in the COMP006 treatment arm met the bar at six weeks. Under the conventional ≥50% definition, the rate would be substantially lower.
Remission is defined by an absolute threshold: a score below which the patient is considered no longer clinically depressed. But the threshold varies. The empirical evidence supports a cutoff around MADRS <10.
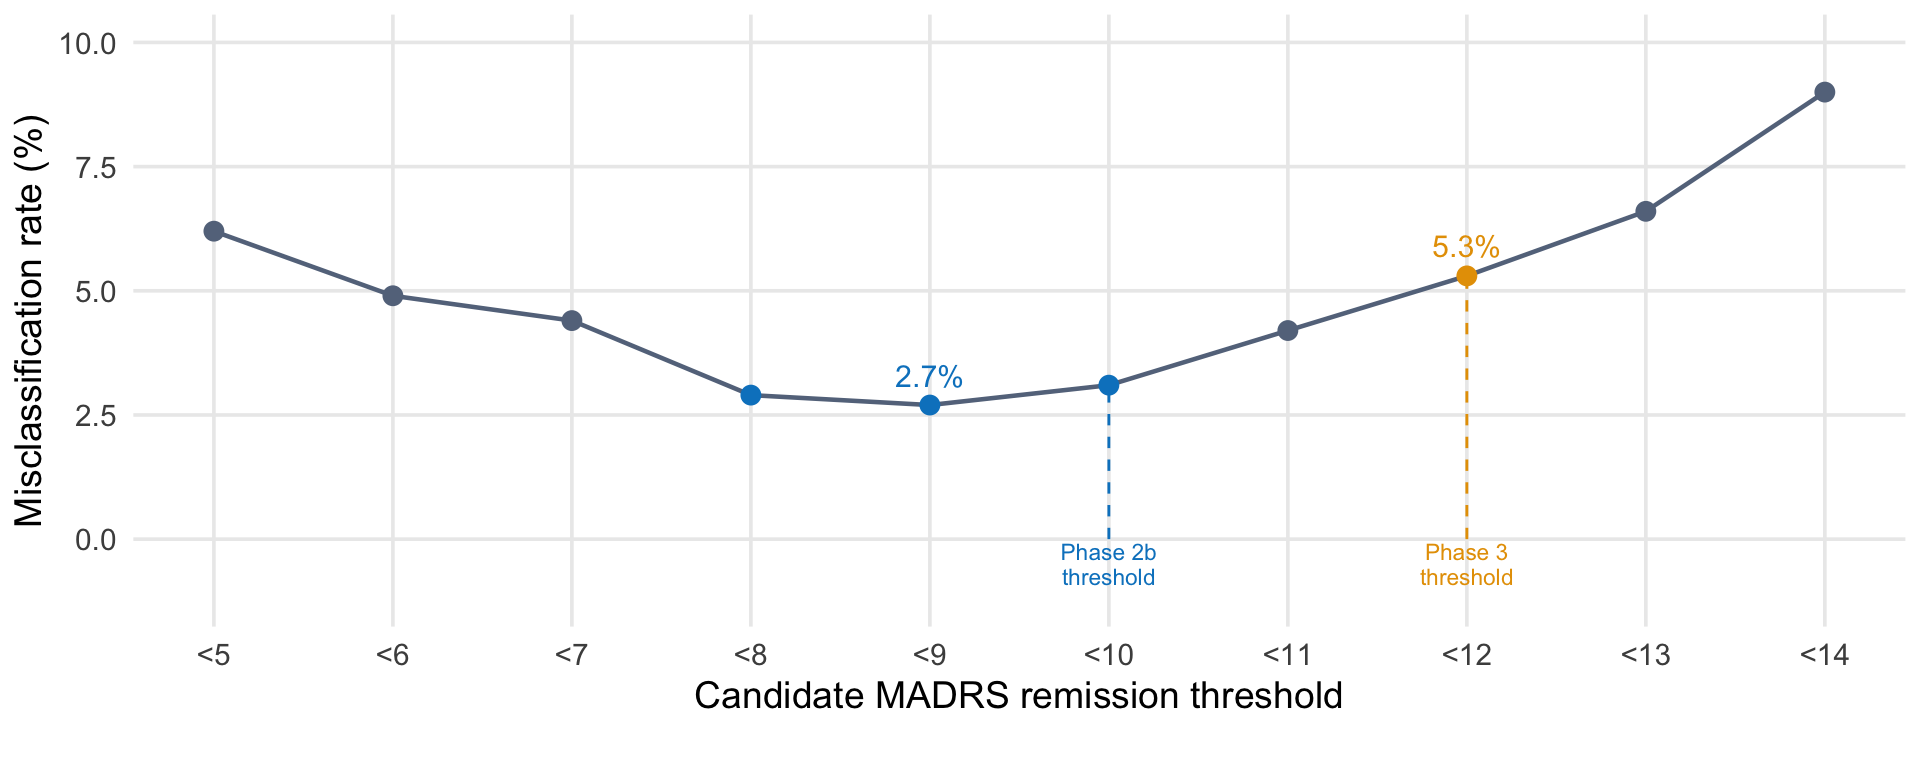
Hawley et al. (2002) tested candidate MADRS thresholds against clinician-rated global severity (CGI-S) across 1,114 observations from 684 patients with major depression. Using a misclassification model—counting how often a given threshold disagreed with whether clinicians judged the patient to be ill or not ill—they found that MADRS <9 yielded the lowest misclassification rate (2.7%), with <10 close behind (3.1%). Either value is empirically defensible. Both have been widely adopted. This figure reproduces the reported misclassification rates at different cutoffs.
Show code
misclass <-tibble(threshold =5:14,label =paste0("<", 5:14),rate =c(6.2, 4.9, 4.4, 2.9, 2.7, 3.1, 4.2, 5.3, 6.6, 9.0))ggplot(misclass, aes(x = threshold, y = rate)) +# Vertical annotation lines for Phase 2b and Phase 3 thresholdsannotate("segment", x =10, xend =10, y =0, yend =3.1,linetype ="dashed", color = ghr_blue, linewidth =0.5) +annotate("segment", x =12, xend =12, y =0, yend =5.3,linetype ="dashed", color = ghr_orange, linewidth =0.5) +annotate("text", x =10, y =-0.5, label ="Phase 2b\nthreshold",size =3, color = ghr_blue, lineheight =0.9) +annotate("text", x =12, y =-0.5, label ="Phase 3\nthreshold",size =3, color = ghr_orange, lineheight =0.9) +geom_line(color = ghr_slate, linewidth =0.8) +geom_point(aes(color =ifelse(threshold ==12, "phase3",ifelse(threshold %in%c(8, 9, 10), "highlight", "normal"))),size =3) +scale_color_manual(values =c("highlight"= ghr_blue, "phase3"= ghr_orange,"normal"= ghr_slate),guide ="none") +geom_text(data =filter(misclass, threshold ==9),aes(label ="2.7%"), nudge_y =0.6, size =4, color = ghr_blue) +geom_text(data =filter(misclass, threshold ==12),aes(label ="5.3%"), nudge_y =0.6, size =4, color = ghr_orange) +scale_x_continuous(breaks =5:14, labels =paste0("<", 5:14)) +coord_cartesian(ylim =c(-1.2, 10), clip ="off") +labs(x ="Candidate MADRS remission threshold",y ="Misclassification rate (%)") +theme(panel.grid.minor =element_blank(),plot.margin =margin(5.5, 5.5, 20, 5.5))
Misclassification rate by candidate MADRS remission threshold. Data from Hawley et al. (2002), who tested candidate thresholds against clinician-rated illness severity (CGI-S) across 955 observations from 684 patients with major depression. The lowest misclassification rate occurs at <9, with <8 and <10 nearly equivalent.
In the Phase 2b trial published in the NEJM, Compass defined remission as MADRS ≤10—consistent with the empirical evidence. Under that threshold, 29% of patients in the 25 mg group achieved remission at week 3, compared with 8% in the 1 mg control group.
In the Phase 3 trials, however, Compass defined remission as MADRS <12—a more liberal threshold that counts patients with slightly more residual symptoms as remitted. The threshold appears to have shifted between trials. As far as I know, Compass has not publicly explained the change, and STAT News noted the discrepancy parenthetically: “Other researchers have defined remission as a MADRS score under 10.”
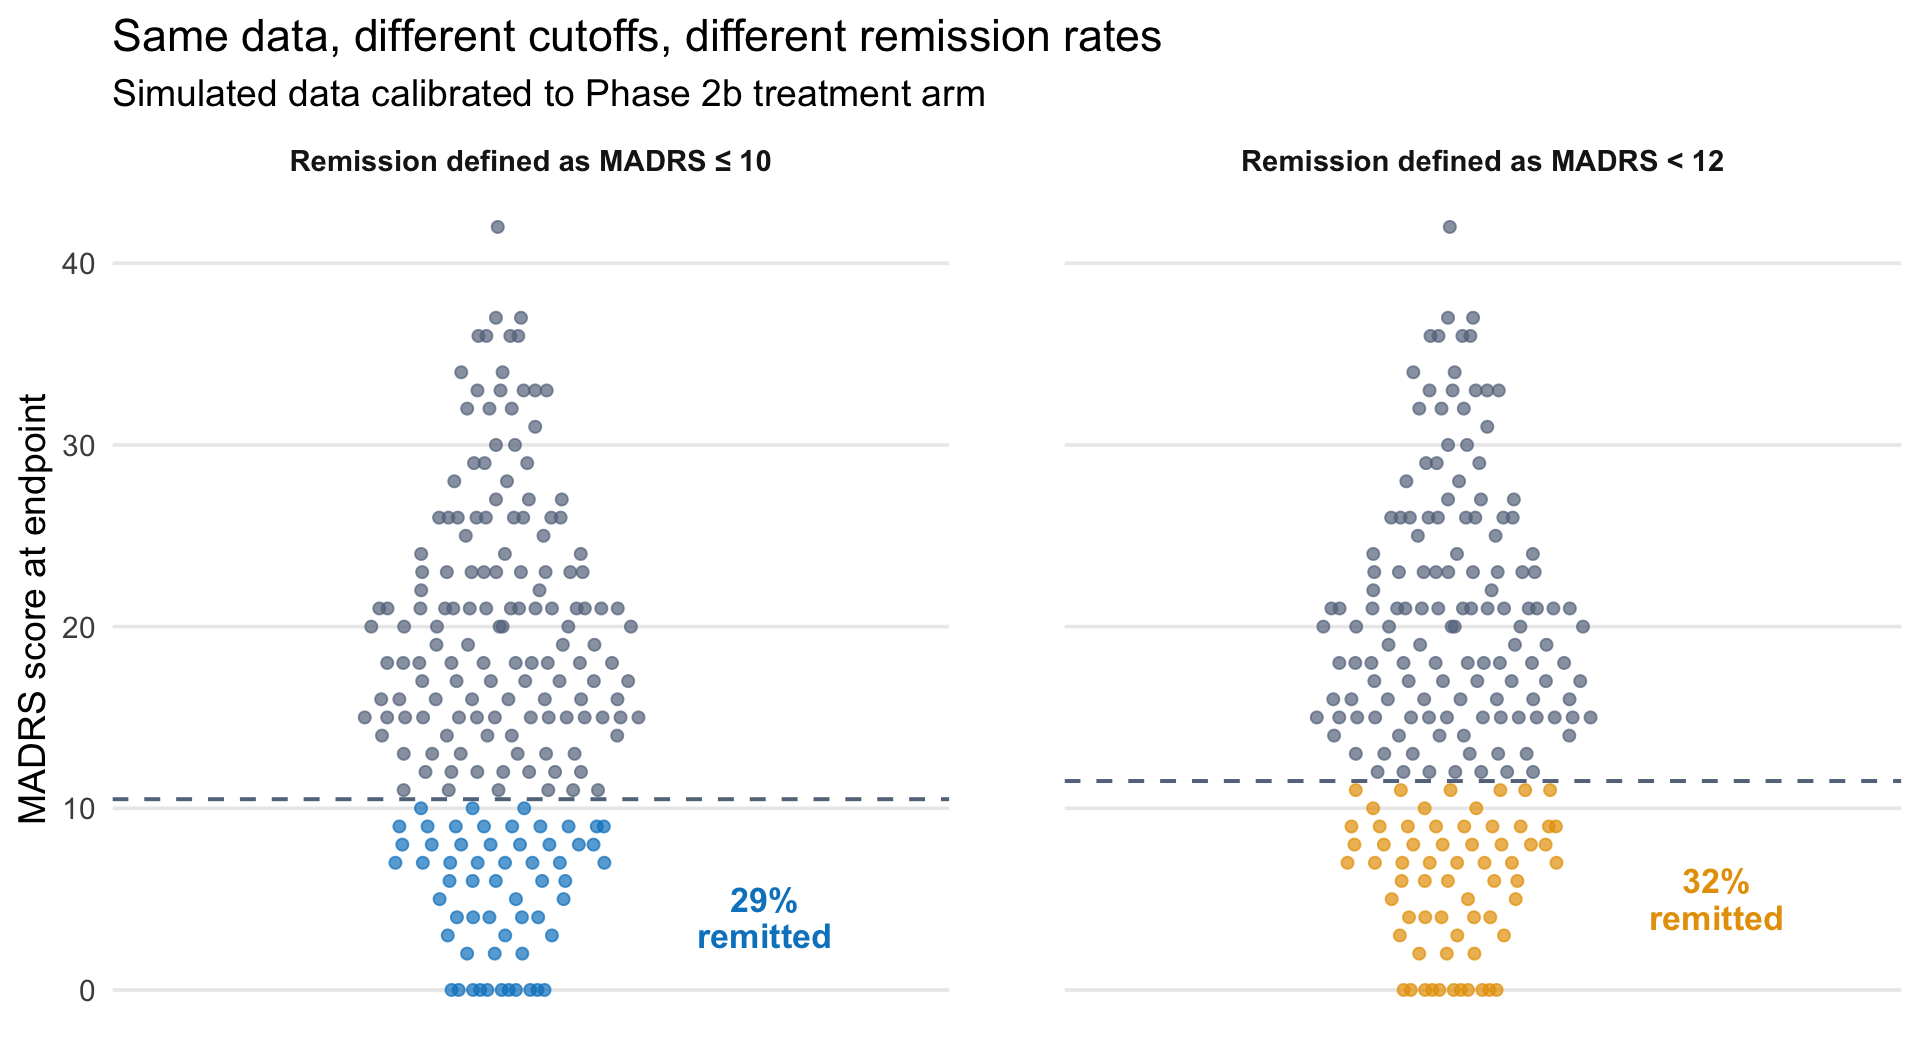
The difference between ≤10 and <12 may seem small on a 60-point scale. But at the margin, it determines who counts as remitted—and therefore what the headline remission rate is. To illustrate, the figure below simulates 200 endpoint scores calibrated to the Phase 2b treatment arm and applies both definitions to the same data. Each dot is a patient. The only difference between the two panels is where the line is drawn—patients scoring exactly 11 are counted as remitted under <12 but not under ≤10. In this simulation, that shifts the remission rate from 29% to 32%.
Show code
library(ggbeeswarm)set.seed(43)# Calibrated to reproduce ~29% remission at MADRS ≤ 10# consistent with Phase 2b 25 mg arm (Goodwin et al., 2022)endpoint_scores <-pmax(0, round(rnorm(200, mean =15.5, sd =10)))rate_10 <-mean(endpoint_scores <=10)rate_12 <-mean(endpoint_scores <12)panel_df <-bind_rows(tibble(score = endpoint_scores,panel ="Remission defined as MADRS \u2264 10",color_group =ifelse(score <=10, "remitted_10", "not_remitted")),tibble(score = endpoint_scores,panel ="Remission defined as MADRS < 12",color_group =ifelse(score <12, "remitted_12", "not_remitted"))) |>mutate(panel =factor(panel, levels =c("Remission defined as MADRS \u2264 10","Remission defined as MADRS < 12")))labels_df <-tibble(panel =factor(levels(panel_df$panel), levels =levels(panel_df$panel)),threshold =c(10.5, 11.5),rate_label =c(paste0(round(rate_10 *100), "%\nremitted"),paste0(round(rate_12 *100), "%\nremitted")),label_y =c(4, 5),label_color =c(ghr_blue, ghr_orange))ggplot(panel_df, aes(x =1, y = score, color = color_group)) +geom_quasirandom(size =1.8, alpha =0.7, width =0.25) +geom_hline(data = labels_df, aes(yintercept = threshold),linetype ="dashed", linewidth =0.7, color = ghr_slate) +geom_text(data = labels_df,aes(x =1.45, y = label_y, label = rate_label, color =NULL),color = labels_df$label_color,size =4.5, fontface ="bold", lineheight =0.9,inherit.aes =FALSE) +scale_color_manual(values =c("remitted_10"= ghr_blue, "remitted_12"= ghr_orange,"not_remitted"= ghr_slate),guide ="none" ) +scale_x_continuous(limits =c(0.4, 1.7)) +scale_y_continuous(breaks =seq(0, 50, 10)) +facet_wrap(~ panel) +labs(title ="Same data, different cutoffs, different remission rates",subtitle ="Simulated data calibrated to Phase 2b treatment arm",x =NULL, y ="MADRS score at endpoint") +theme(panel.grid.minor =element_blank(),panel.grid.major.x =element_blank(),axis.text.x =element_blank(),axis.ticks.x =element_blank(),strip.text =element_text(size =11, face ="bold"),panel.spacing.x =unit(3, "lines"))
Same simulated endpoint data (n = 200, calibrated to the Phase 2b 25 mg treatment arm), two definitions of remission. Each dot is a patient. Points below the dashed line are counted as remitted. The Phase 2b trial defined remission as MADRS ≤ 10 and reported 29%. Applying the Phase 3 definition (MADRS < 12) to the same data reclassifies patients scoring 11, raising the rate.
The choice of threshold is not arbitrary—it reflects a judgment about what level of residual symptoms is acceptable. But it is a convention, not a measurement property. And conventions shape headlines.
Minimum Clinically Important Difference
The primary endpoint in the Compass trials was the mean change in MADRS from baseline, comparing psilocybin to control. COMP005 showed a 3.6-point advantage over placebo. COMP006 showed a 3.8-point advantage over a 1 mg active control. Both were statistically significant.
But how large a difference matters clinically? This is the question the minimum clinically important difference (MCID) is designed to answer. The MCID is the smallest change on a scale that patients or clinicians would perceive as meaningful. Unlike statistical significance, which depends on sample size and variability, the MCID is an empirical estimate about perception.
Compass pre-specified a 3-point drug-placebo difference as the threshold for success. By that standard, both trials succeeded. Guy Goodwin, Compass’s chief medical officer, said after the COMP005 readout: “Usually people accept 3 as a clinically meaningful difference.”
That is approximately the average drug-placebo difference observed across meta-analyses of conventional antidepressants. In other words, psilocybin—which produces a profound acute experience, requires a supervised clinical setting, and was expected to represent a step change in depression treatment—produced a mean advantage over placebo that is roughly equivalent to what SSRIs achieve.
This does not mean psilocybin is ineffective. A 3.6-point mean difference can mask heterogeneous individual responses: some patients may experience large improvements while others show little change. And the MADRS may not capture the full range of benefits. But the mean difference is what regulatory decisions are built on, and at 3.6 points, it sits at the lower end of MCID estimates.
One way to visualize that magnitude is this: a 3-point difference is roughly equivalent to shifting a single item—say, Reported Sadness—from a score of 3 (moderate) to 0 (absent), with all other items unchanged. On a 60-point scale, that is about a 5% shift in total possible score.3
Is this life changing at the mean? Probably not, but clinically important is a lower bar.
It is worth remembering, though, that these trials enrolled patients with treatment-resistant depression—people who had already failed adequate courses of conventional antidepressants. A 3-point difference is a 3-point difference regardless of the population—meaning it represents the same magnitude of symptom reduction—but the context influences how we should think about it. Any measurable improvement in a population defined by non-response to available treatments carries different clinical weight than the same-sized effect in a treatment-naïve population. But the question remains, is 3 points clinically meaningful in what it represents? For someone who has not had any luck with other approaches, the answer might be ‘yes’ if side effects are tolerable. Let’s hope it’s a start in what this class of intervention can achieve.
The Debate Behind the Numbers
The market’s reaction to the Compass results was split. The company’s stock fell nearly 50% when COMP005 reported in June 2025—then surged roughly 40% eight months later when COMP006 reported a similar effect size. The results were comparable; the reception was not. Analysts debated whether 3.6 or 3.8 points was “enough.” Clinicians noted the low remission rates. Compass called the results clinically meaningful. Others were less sure.
The disagreement is not primarily about the data. It is about what we expect a scale score to tell us, what thresholds we apply, and whether the conventions developed for one class of drugs translate to another.
Three things are worth keeping in view:
Statistical significance and clinical meaning are separate questions with separate tools. A p-value tells you how surprising your data would be if there were truly no difference between groups. The MCID tells you whether patients would notice. Both Compass trials cleared the first bar. Whether they cleared the second depends on which MCID estimate you trust.
Thresholds for response and remission are choices. The difference between MADRS <10 and MADRS <12 is a difference in what we agree to count as “remitted” or well. Choosing a more liberal threshold produces a higher remission rate from the same data.
Outcome scales embed assumptions about what improvement looks like. The MADRS was built to detect pharmacological effects on sadness, sleep, appetite, and concentration. If psilocybin’s most important effects operate in domains the scale doesn’t measure—meaning, connectedness, outlook—then the MADRS may systematically underestimate benefit. This is not a reason to dismiss the results. It is a reason to develop better measurement tools for the treatment being tested.
This is the first in a two-part series on the Compass Pathways psilocybin trials. Part 2, Can You Blind a Psychedelic?, examines what happens to treatment effect estimates when participants know whether they received the drug.
Footnotes
Why two Phase 3 trials? The pairing is a regulatory strategy. COMP005 (n=255) used a true placebo, which FDA required as the evidentiary standard. COMP006 (n=572) used a 1 mg psilocybin dose as an active comparator, intended to mitigate the blinding problem inherent in psychedelic trials—participants who feel nothing know they got placebo. Running both designs lets Compass present one trial that meets FDA’s placebo requirement and another that addresses the structural unblinding concern. The Phase 3 results discussed here come from Compass Pathways press releases (June 2025 and February 2026), not peer-reviewed publications. The company released limited data at FDA’s instruction to avoid influencing participants still enrolled in blinded portions of the trials. Full results have not yet been published.↩︎
The Phase 2b trial tested three doses (25 mg, 10 mg, 1 mg) with the primary endpoint at 3 weeks rather than 6. It reported a larger treatment effect (6.6-point MADRS advantage for 25 mg over 1 mg) than either Phase 3 trial (3.6–3.8 points). That attenuation from Phase 2 to Phase 3 is common: smaller samples produce noisier estimates, and the populations, designs, and control conditions often differ.↩︎
The observed treatment effect is the difference in mean change from baseline between groups. Individual patients may improve much more or much less than the group mean, and improvements are typically distributed across multiple items rather than concentrated in a single domain. But this helps me to think about what a 3-point change means for someone in the trial.↩︎